

3. Plots
The first three vibration modes of a string, one per column of a matrix.
fortran
!< tut03_plots, tutorial chapter 3: line plots of Fortran arrays.
program tut03_plots
!< tut03_plots, tutorial chapter 3: line plots of Fortran arrays.
use, intrinsic :: iso_fortran_env, only : int32, real64
use figure, only : app_object, ig_begin, ig_end, ig_set_next_window, ip_begin_plot, ip_end_plot, ip_line, ip_setup_axes

implicit none
integer(int32), parameter :: N = 200_int32 !< Points.
integer(int32), parameter :: M = 3_int32   !< Modes.
type(app_object)          :: app           !< Application.
real(real64)              :: x(N)          !< Abscissae.
real(real64)              :: modes(N, M)   !< One mode per column.
integer(int32)            :: i             !< Counter.
integer(int32)            :: k             !< Mode counter.
character(len=8)          :: label         !< Legend label.

x = [(real(i - 1, real64) / real(N - 1, real64), i = 1_int32, N)]
do k = 1_int32, M
   modes(:, k) = sin(real(k, real64) * acos(-1.0_real64) * x)
enddo

call app%init('FIGURE: plots', 900_int32, 700_int32)
do while (app%next_frame())
   call ig_set_next_window(20.0_real64, 20.0_real64, 860.0_real64, 600.0_real64)
   if (ig_begin('Modes')) then
      if (ip_begin_plot('Vibration modes', height=300.0_real64)) then
         call ip_setup_axes('x', 'amplitude')
         do k = 1_int32, M
            write(label, '(A,I0)') 'mode ', k
            call ip_line(trim(label), x, modes(:, k))
         enddo
         call ip_end_plot()
      endif
      if (ip_begin_plot('##first mode', height=200.0_real64)) then
         call ip_line('mode 1', x, modes(:, 1))
         call ip_end_plot()
      endif
   endif
   call ig_end()
enddo
call app%destroy()
endprogram tut03_plots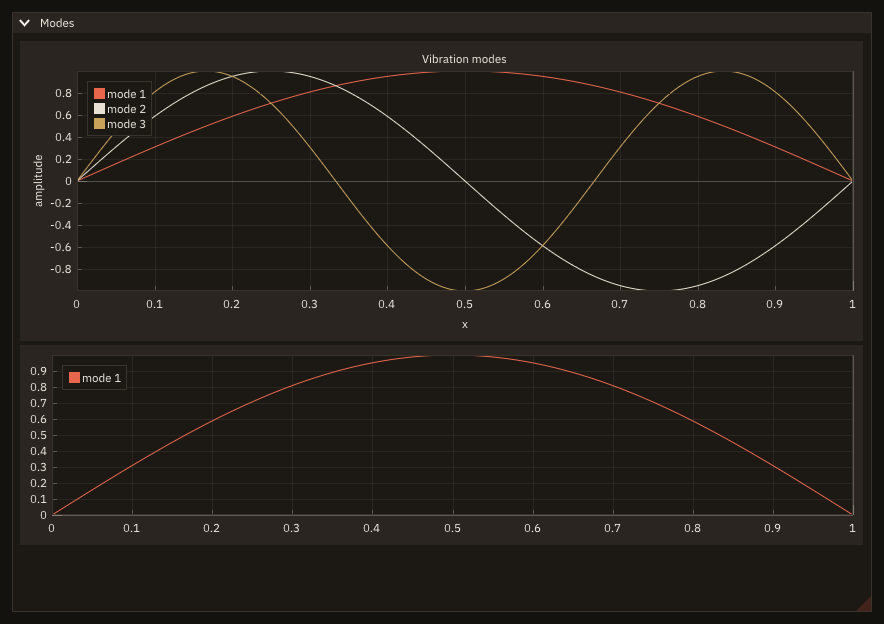
A plot
fortran
if (ip_begin_plot('Vibration modes', height=300.0_real64)) then
   call ip_setup_axes('x', 'amplitude')
   do k = 1_int32, M
      write(label, '(A,I0)') 'mode ', k
      call ip_line(trim(label), x, modes(:, k))
   enddo
   call ip_end_plot()
endifip_begin_plotbegins a plot 300 pixels high, full width; it returns.true.when the plot is visible, and only then are its items declared andip_end_plotcalled.ip_setup_axeslabels the axes; it comes before the items.ip_line(label, x, y)draws a line;labelis its legend entry.modes(:, k)is a column, contiguous: ImPlot reads it in place, without a copy. A row,modes(k, :), is strided: its elements are a column's length apart in memory, which the compiler may copy before the call (Data in place).
In the window, drag to pan, use the wheel to zoom, double-click to fit, click a legend entry to hide its line.
A plot without title
fortran
if (ip_begin_plot('##first mode', height=200.0_real64)) then
   call ip_line('mode 1', x, modes(:, 1))
   call ip_end_plot()
endif
The title is also the plot's identifier: '##first mode' keeps an identifier and shows no title.
What you learned
Plots, axes, lines, and why columns are cheaper than rows. Reference: Plots.
Next: 4. A live computation.