Canvas
A canvas is the way a Fortran program builds a widget FIGURE does not have: a sketch of the domain with its boundary conditions, a gauge, a timeline. It has two parts. ig_canvas places an area of a given size that takes the mouse and reports, every frame, what happened over it; the drawing primitives ig_draw_* draw lines, rectangles, circles, polylines, polygons, text and images, on the canvas or anywhere else in the window, over every window, or inside a plot in the plot's own units. Hit testing is the program's: the canvas says where the pointer is, the program decides what is under it.
The primitives draw on Dear ImGui's draw lists, which window, headless and remote mode all render, so a canvas works in every mode, and the headless tests find what it drew by its colours (Testing a canvas).
The canvas
| Procedure | Notes |
|---|---|
ig_canvas(id, width, height, ev [, texture] [, stat]) | An area that takes the three mouse buttons and the wheel (InvisibleButton, SetItemKeyOwner); ev receives what happened over it on this frame. |
ig_invisible_button(id, width, height [, stat]) → logical | A button that draws nothing (InvisibleButton): .true. on the frame it is clicked with the left button. |
ig_cursor_screen_pos(x, y) | Where the next item goes, in screen pixels (GetCursorScreenPos). |
width and height are pixels; a size of 0 or below is the space left in the window plus it (0: all of it, -10: all but 10 pixels), at least 1 pixel. The canvas is one item: ig_last_item, ig_same_line, tooltips and context menus apply to it as to a button. With texture, the texture is drawn over the whole canvas before the program draws on it: a computed image with marks on top.
ev is a canvas_event_object, a plain value filled on every call:
| Field | Type | Meaning |
|---|---|---|
hovered | logical | the pointer is over the canvas, and no other item is held |
active | logical | a button pressed over the canvas is held (a drag goes on outside the canvas too) |
clicked(3) | logical | a button was pressed over the canvas on this frame (left, right, middle) |
double_clicked(3) | logical | a button was double-clicked over the canvas on this frame |
down(3) | logical | a button pressed over the canvas is held |
released(3) | logical | a button pressed over the canvas was released on this frame |
mouse(2) | real(real64) | the pointer from the canvas's top-left [pixels], x right and y down; also outside the canvas (below 0 or beyond its size) |
drag(2) | real(real64) | the pointer from where the held button was pressed [pixels]: while held, and on the frame of its release; 0 otherwise |
delta(2) | real(real64) | the pointer's motion on this frame while a button is held [pixels] |
wheel, wheel_h | real(real64) | vertical (positive away from the user) and horizontal wheel steps on this frame, while hovered; 0 otherwise |
ctrl, shift, alt, super | logical | the modifiers held (super: cmd on macOS, the Windows key) |
origin(2) | real(real64) | the canvas's top-left on the screen [pixels] |
size(2) | real(real64) | its width and height [pixels] |
The wheel is the canvas's while the pointer is over it (Dear ImGui's key ownership, as the 3-D view): a window or a child holding the canvas does not scroll, so a canvas can zoom with the wheel inside a scrolling form. Beside the canvas the wheel scrolls the window as usual.
The event states (clicked, double_clicked, released) are true on one frame: the frame of the event, the frame the program reads them. A press is reported on the frame of the press (a drag starts there); for a click that must be released over the canvas, as a button's, use ig_invisible_button or test released together with hovered.
call ig_canvas('domain', 0.0_real64, 200.0_real64, ev)  ! the window's width, 200 pixels high
scale = (ev%size(1) - 80.0_real64) / 4.0_real64        ! 4 m across, 40 pixels free each side
hovered = 0_int32
if (ev%hovered) hovered = nearest(ev%mouse(1), ev%mouse(2))
if (ev%clicked(1)) selected = hovered                  ! a click on empty space clears the selection
if (hovered > 0_int32) then
   if (ig_begin_tooltip()) then
      call ig_text(trim(BOUNDARY(hovered))//': '//trim(CONDITION(bc(hovered)))//' (click to change)')
      call ig_end_tooltip()
   endif
endif- Pairing and frame rules: none opens a scope; call them in a window, between
next_frameand the next one. Readevon the frameig_canvasfilled it. - Status:
statis optional. A size NaN, infinite or beyond single precision, or a texture not initialized, isFIG_ERR_ARGUMENT: nothing placed,evempty (absentstat:error stopwith the message). With no frame open, or from a task, each is refused withFIG_ERR_STATE, as every drawing call. Messages: Error handling. - Window, headless, remote: the same; headless,
test_mouse_move,test_click,test_dragandtest_wheeldrive the canvas (Testing a canvas). - Threads: the frame loop's thread only; a task is refused (
FIG_ERR_STATE).
Coordinates
Three systems, and each call says which it takes:
| System | Origin and axes | Used by |
|---|---|---|
| screen pixels | the display's top-left, x right, y down | the primitives on the 'window', 'foreground' and 'background' layers; ev%origin; ig_cursor_screen_pos; ig_last_item's rect; the testing procedures |
| canvas pixels | the canvas's top-left, x right, y down | ev%mouse |
| plot units | the plot's axes, as its data | the primitives on the 'plot' layer |
A point (cx, cy) of a canvas is drawn at ev%origin(1) + cx, ev%origin(2) + cy. A program with its own units (metres, seconds) maps them to canvas pixels itself, and back for the pointer: the domain sketch above keeps y up by py(y) = origin + ... - y * scale. Lengths (thickness, radius) are pixels on every layer, also on the plot layer. ig_cursor_screen_pos gives where the next item goes, so a program can draw at that place and then reserve it with ig_dummy or an invisible button: a gauge, its frame and its level drawn where the next item goes, then reserved by an invisible button that takes its clicks:
call ig_cursor_screen_pos(at(1), at(2))                 ! where the next item goes [screen pixels]
call ig_draw_rect(at(1), at(2), at(1) + 300.0_real64, at(2) + 24.0_real64, [0.5_real64, 0.5_real64, 0.5_real64])
call ig_draw_rect(at(1), at(2), at(1) + 300.0_real64 * level, at(2) + 24.0_real64, FILL, filled=.true.)
if (ig_invisible_button('gauge', 300.0_real64, 24.0_real64)) level = 1.0_real64 ! reserves the place, takes clicks
Layers
layer | Draws on | Coordinates | Clipped to |
|---|---|---|---|
'window' (default) | the current window's draw list: over what the window drew before, under what it draws after | screen pixels | the window (its scrolling region) |
'foreground' | the display's foreground list: over every window | screen pixels | nothing |
'background' | the display's background list: under every window | screen pixels | nothing |
'plot' | the current plot's draw list, between a true ip_begin_plot and ip_end_plot | plot units | the plot area |
The window layer is the canvas's: what is drawn there scrolls with the window and hides behind the windows in front. The foreground layer draws over everything, popups included: a marker that follows the pointer across windows, a highlight of a window's place in a tour. The background layer is under every window, on the display's background.
The plot layer places a shape in the data's units inside a plot (ImPlot::GetPlotDrawList, PlotToPixels, PushPlotClipRect): a probe's position, the outline of the domain over a field, a band of interest. It moves and scales with the plot's limits when the user pans and zooms, and it is clipped to the plot area. Call the primitives after the plot's setup (ip_setup_axes, ip_setup_axes_limits): the first primitive ends the setup, as the first item does. Outside a plot it is a usage error, FIG_ERR_STATE.
if (ip_begin_plot('##plot layer', 860.0_real64, 170.0_real64)) then
   call ip_setup_axes('x [m]', 'y [m]')
   call ip_setup_axes_limits(0.0_real64, 4.0_real64, -0.2_real64, 1.2_real64)
   call ip_line('u', x * 4.0_real64, 0.5_real64 + 0.4_real64 * sin(6.0_real64 * x))
   call ig_draw_rect(0.0_real64, 0.0_real64, 4.0_real64, 1.0_real64, TEAL, 2.0_real64, layer='plot')
   call ig_draw_circle(1.0_real64, 0.5_real64, 12.0_real64, AMBER, filled=.true., layer='plot')
   call ig_draw_text(1.1_real64, 0.45_real64, 'probe at (1, 0.5) m', AMBER, layer='plot')
   call ip_end_plot()
endif
Primitives
| Procedure | Draws (upstream) |
|---|---|
ig_draw_line(x1, y1, x2, y2, color [, thickness] [, layer] [, stat]) | a segment (ImDrawList::AddLine) |
ig_draw_rect(x1, y1, x2, y2, color [, thickness] [, filled] [, layer] [, stat]) | a rectangle with opposite corners in any order, outline or filled (AddRect, AddRectFilled) |
ig_draw_circle(x, y, radius, color [, thickness] [, filled] [, layer] [, stat]) | a circle, its centre at the point and its radius in pixels, outline or filled (AddCircle, AddCircleFilled) |
ig_draw_polyline(x, y, color [, thickness] [, closed] [, layer] [, stat]) | a polyline through x(i), y(i); closed joins the last point to the first (AddPolyline) |
ig_draw_polygon(x, y, color [, thickness] [, filled] [, layer] [, stat]) | a closed polygon, outline or filled, convex or not, its sides not crossing when filled (AddPolyline closed, AddConcavePolyFilled) |
ig_draw_text(x, y, text, color [, layer] [, stat]) | text in the current font, its top-left at the point; a line per LF (AddText) |
ig_draw_image(texture, x1, y1, x2, y2 [, color] [, layer] [, stat]) | a texture stretched over a rectangle, pixel row 1 at the top, multiplied by color (default white) (AddImage) |
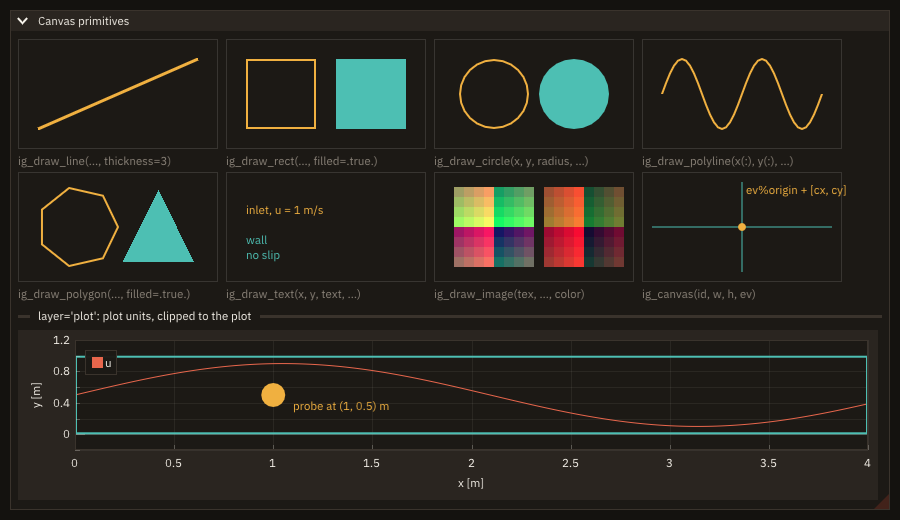
ig_draw_line draws a segment, ig_draw_rect a rectangle and ig_draw_circle a circle (outlines, or filled), ig_draw_polyline a line through arrays of points (closed with closed=.true.), ig_draw_polygon a polygon, ig_draw_text a text from its top-left corner in the current font, and ig_draw_image a texture stretched over a rectangle, its pixels multiplied by color (default white: as they are). Coordinates are real(real64): screen pixels, or plot units on the plot layer (Coordinates). thickness is in pixels, default 1; filled defaults to the outline. x(:) and y(:) of a polyline or a polygon are arrays of the same size, at least 2 and 3 points: a contiguous array goes to the native layer without a copy (a strided section is packed by the compiler). A filled ig_draw_polygon must be simple, its sides not crossing and without holes: Dear ImGui triangulates it by ear clipping (AddConcavePolyFilled), which assumes so and costs O(n²) in its points; a polygon whose sides cross is not filled correctly. A circle's radius is pixels on every layer: a marker. A circle in plot units is a polygon through its points.
do b = 1_int32, NB
   w(b) = merge(4.0_real64, 2.0_real64, b == hovered .or. b == selected)
enddo
call ig_draw_rect(px(0.0_real64), py(0.0_real64), px(4.0_real64), py(1.0_real64), &
                  [0.5_real64, 0.5_real64, 0.5_real64, 0.25_real64], filled=.true.)
call ig_draw_line(px(0.0_real64), py(0.0_real64), px(0.0_real64), py(1.0_real64), HUE(:, bc(1)), w(1))
call ig_draw_line(px(4.0_real64), py(0.0_real64), px(4.0_real64), py(1.0_real64), HUE(:, bc(2)), w(2))
call ig_draw_line(px(0.0_real64), py(0.0_real64), px(4.0_real64), py(0.0_real64), HUE(:, bc(3)), w(3))
call ig_draw_line(px(0.0_real64), py(1.0_real64), px(4.0_real64), py(1.0_real64), HUE(:, bc(4)), w(4))
call ig_draw_circle(px(XC), py(YC), RC * scale, [0.1_real64, 0.1_real64, 0.1_real64], filled=.true.)
call ig_draw_circle(px(XC), py(YC), RC * scale, HUE(:, bc(5)), w(5))
call ig_draw_text(px(0.0_real64) - 36.0_real64, py(0.5_real64) - 8.0_real64, 'inlet', HUE(:, bc(1)))
call ig_draw_text(px(4.0_real64) + 4.0_real64, py(0.5_real64) - 8.0_real64, 'outlet', HUE(:, bc(2)))
call ig_draw_text(px(2.0_real64), py(0.0_real64) + 4.0_real64, 'bottom', HUE(:, bc(3)))
call ig_draw_text(px(2.0_real64), py(1.0_real64) - 20.0_real64, 'top', HUE(:, bc(4)))
call ig_draw_text(px(XC) + RC * scale + 6.0_real64, py(YC) - 8.0_real64, 'cylinder', HUE(:, bc(5)))
Colours are [r, g, b] or [r, g, b, a] in [0, 1], as the rest of FIGURE (ig_text_colored, ig_table_row_color); a defaults to 1, and the style's global alpha multiplies it. A colour carries meaning only together with a mark or a word: the domain sketch writes each boundary's name beside it in its colour. The style's own colours are given by ig_get_style_color and app%palette_color, so a drawing can follow the theme.
Nothing is kept between frames: a primitive draws on the frame it is called. Draw every frame, as every widget is declared every frame.
- Pairing and frame rules: none opens a scope. Plot layer: between a true
ip_begin_plotandip_end_plot. - Status:
statis optional. A wrong argument isFIG_ERR_ARGUMENT, nothing drawn (absentstat:error stopwith the message): an unknown layer; a colour not of 3 or 4 components in [0, 1];xandyof different sizes or too few points; a coordinate NaN, infinite or beyond single precision; a thickness not above 0; a radius below 0; a texture not initialized. The plot layer outside a plot, no frame open, or a call from a task:FIG_ERR_STATE, a usage error. Messages: Error handling. - Window, headless, remote: the same. Remote mode sends the draw lists to the browser as every widget's; images go as textures.
- Threads: the frame loop's thread only; a task is refused (
FIG_ERR_STATE).
Testing a canvas
A canvas is tested headless as any widget: test_mouse_move, test_click(x, y [, button]), test_drag and test_wheel drive it (Headless testing), at screen pixels computed from ev%origin. What the primitives drew is found by test_drawn_extent(color, ...), the extent of the vertices drawn so far in that colour: give each primitive a colour of its own. layer='foreground' or 'background' looks on those layers (the window and plot layers are the window's own list); vertices gives how many vertices have the colour, which tells a filled shape (a vertex per corner) from its outline. src/tests/figure_test_canvas.F90 checks every primitive this way, a drag's delta, the wheel kept from a scrolling child, and a polyline in plot units that moves with the limits. The gauge above, after a click on it (docs/examples/src/cb_canvas_test.F90, run headless by the documentation's build):
call test_drawn_extent(FILL, e(1), e(2), e(3), e(4), found=found, vertices=vertices) ! drawn so far in FILL$ ./cb_canvas_test
found: T, width: 300 pixels at level 1.0, 4 vertices (a filled rectangle)What it does not do
- No hit testing of shapes: the canvas reports the pointer; which shape is under it is the program's computation (the domain sketch's
nearest). An invisible button over a shape gives a rectangular hot zone. - No clipping to the canvas: primitives on the window layer are clipped to the window, not to the canvas; keep them inside it, or draw a shape that ends at its border.
- No retained scene: nothing is stored; a drawing of thousands of primitives costs that many calls every frame. For a field use a heatmap or an image; for many points, a plot.
- No transforms, gradients, dashes or rounded corners: coordinates go as given; a dashed line is segments; a transform is the program's mapping. Rounded rectangles, Bézier curves and gradients are in Dear ImGui's draw list, which neither the primitives nor the raw bindings reach: cimgui's
ImDrawList_*C functions need abind(C)interface written by the program (igGetWindowDrawListgives the list). - No font size per call: text is drawn in the current font (Fonts).
- Plot layer limits: the radius and the thickness stay in pixels; a point farther than 10⁷ pixels from the display's origin (a strong zoom) is drawn at that distance, which bends a line from a point in view to it; on a logarithmic axis a value at or below 0 is taken as the smallest positive
real64(ImPlot's rule), far below the plot. - No keyboard input: the canvas takes the mouse, not the keyboard focus; keys reach the program through shortcuts of the window holding it.