Colormaps
A colormap turns a value into a colour: a heatmap colours each cell of a field with it, a field image a whole field on a linear, log or symlog scale, and its colour bar (ip_colormap_scale) shows the scale. FIGURE bundles the maps that scientific plotting has settled on (matplotlib's, cmocean's, ParaView's Cool to Warm, Fabio Crameri's), knows ImPlot's own, and loads the user's from a CSV table or a ParaView preset. All of them are chosen by name, reversed or cut into discrete bands. Contour lines take their colours from a colormap too, each level the colour of its value.
Procedures
| Procedure | Notes |
|---|---|
ip_colormap(name [, levels] [, stat]) → integer(int32) | the ImPlot id of the map name, for the colormap argument of ip_heatmap, ip_field_image, ip_colormap_scale and the legends; <name>_r reversed, levels discrete bands; -1 on a failure |
ip_load_colormap(name, file [, stat]) | read a map from a CSV table or a ParaView JSON preset and register it as name |
ip_colormap_names(names) | the names ip_colormap knows, character(len=:), allocatable :: names(:) |
ig_gradient_edit(id, colormap [, width] [, height] [, stat]) → logical | a gradient editor of the map named colormap: its stops dragged, added, recoloured, removed; .true. on the frame the map changed (Editing a colormap) |
ip_colormap_stops(name, positions, colours [, stat]) | the map's stops in order of position, real(real64), allocatable :: positions(:), colours(:,:): positions(k) in [0, 1], colours(3, k) the RGB of stop k, in [0, 1]; both of size 0 on a failure (Editing a colormap) |
cmap = ip_colormap('vik', levels=10_int32)      ! diverging, ten bands: zero sits between two of them
if (ip_begin_plot('vorticity', width=300.0_real64, height=300.0_real64)) then
   call ip_heatmap('w', w, 0.0_real64, 1.0_real64, 0.0_real64, 1.0_real64, scale_min=-1.0_real64, &
                   scale_max=1.0_real64, colormap=cmap)
   call ip_end_plot()
endif
call ig_same_line()
call ip_colormap_scale('##w', -1.0_real64, 1.0_real64, height=300.0_real64, colormap=cmap)
A recipe for this: Colour a field with a map by name, reversed or in bands.
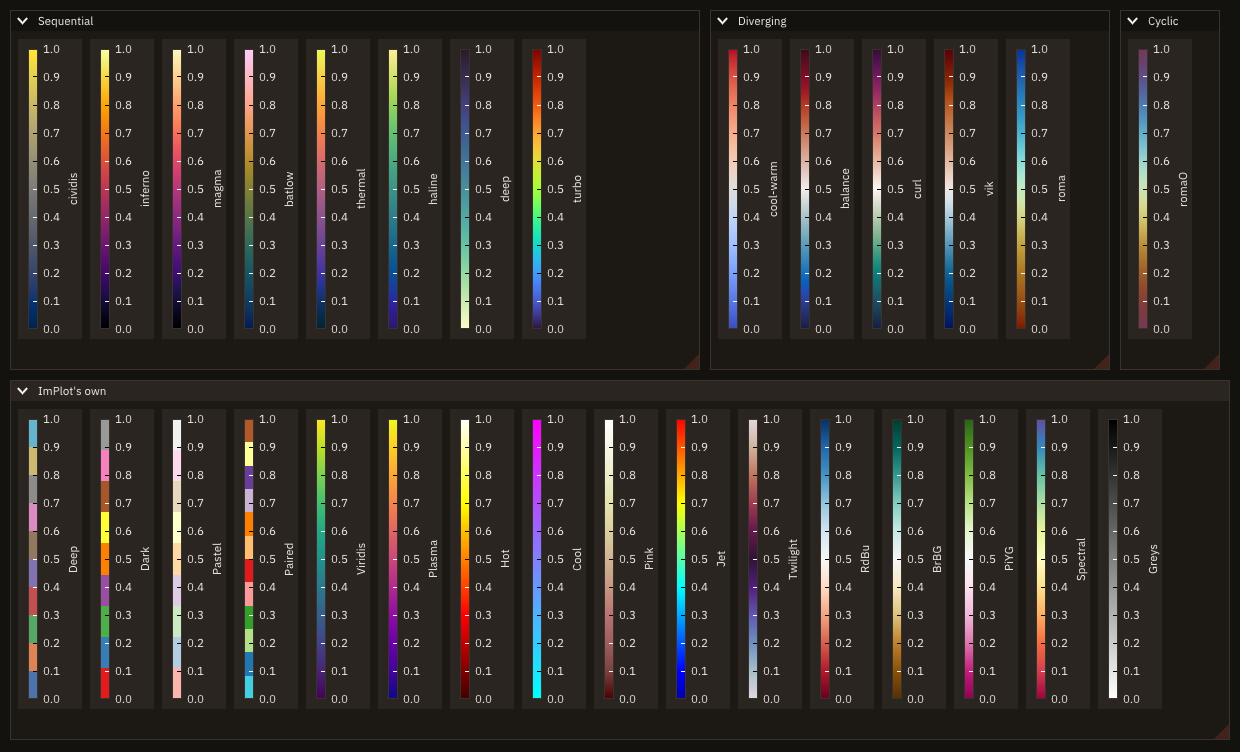
Names. Names are case-sensitive: the bundled maps are in lower case ('cividis', 'cool-warm', and Crameri's 'romaO'), ImPlot's own keep ImPlot's names ('Viridis', 'Jet'; the constants ImPlotColormap_* are their ids), a loaded map keeps the name it was given. So 'deep' is cmocean's sequential map and 'Deep' ImPlot's qualitative one. ip_colormap_names lists the bundled maps (alphabetical), then ImPlot's sixteen (in ImPlot's order), then the loaded ones (in load order); reversed and discrete maps are not listed.
call ip_colormap_names(names)
write(output_unit, '(I0,A)') size(names), ' colormaps, the first ones:'
write(output_unit, '(*(A,:,", "))') (trim(names(i)), i = 1, 6)
Registration. A map is registered with ImPlot (AddColormap) at its first use: ip_colormap called again with the same name and levels returns the same id. ImPlot keeps its colormaps for the life of its context and cannot replace one, so an id holds until app%destroy; after a new init* the maps are registered again at their next use, possibly under other ids. Ask ip_colormap every frame (the lookup is cheap) rather than keeping an id across an app%destroy. A map keeps its id when its colours are edited.
The default. ip_heatmap and ip_colormap_scale without colormap use ImPlot's Viridis, perceptually uniform: not ImPlot's current colormap, which holds the style's line colours. An id that is not registered (-1, a stale one) is refused with FIG_ERR_ARGUMENT.
Changed in v0.3.0
Up to v0.2.0, heatmaps and the colour scale without colormap took ImPlot's current colormap: with FIGURE's styles, the style's line colours, a few distinct hues that do not order values. From v0.3.0 they default to Viridis, so a heatmap drawn by v0.2.0 code changes colours. Code that wants a given map passes it: colormap=ip_colormap('Viridis'), or any other name.
The bundled maps
Each is a table of 256 RGB samples, embedded in the library at build time.
| Kind | Name | From |
|---|---|---|
| sequential | cividis | matplotlib; designed for colour-vision deficiency (Nuñez, Anderton and Renslow) |
| sequential | inferno, magma | matplotlib (Smith and van der Walt) |
| sequential | batlow | Crameri's Scientific colour maps |
| sequential | thermal, haline, deep | cmocean (Thyng): temperature, salinity, depth |
| sequential | turbo | Google (Mikhailov), through matplotlib: a rainbow, smoother than Jet but not uniform |
| diverging | cool-warm | Moreland's table of ParaView's "Cool to Warm" |
| diverging | balance, curl | cmocean |
| diverging | vik, roma | Crameri's Scientific colour maps |
| cyclic | romaO | Crameri's Scientific colour maps: the two ends meet |
ImPlot's own are Viridis, Plasma, Hot, Cool, Pink, Jet, Twilight (cyclic), Greys; the diverging RdBu, BrBG, PiYG and Spectral; and the qualitative Deep, Dark, Pastel and Paired, which are lists of distinct colours for categories, not scales.
How to choose
- A quantity from low to high (temperature, density, a residual's magnitude): a sequential map.
cividis,batlow,inferno,magmaand Viridis change lightness evenly from one end to the other, so equal steps of value look like equal steps of colour, and they keep their order in greyscale and for the common colour-vision deficiencies. - A quantity with a meaningful zero or reference (vorticity, a velocity component, a difference from a baseline): a diverging map, with the reference at its centre: give
scale_min = -scale_max.cool-warm,balance,vik. - An angle or a phase (wind direction, the phase of a wave): a cyclic map, whose ends meet, so that 359° and 1° look alike:
romaO, Twilight. - Categories (zones, materials, the rank that owns a cell): a qualitative map with
levelsequal to the number of categories, or Deep.
The Scientific colour maps page of Fabio Crameri and the cmocean documentation discuss each map's use.
Why not Jet
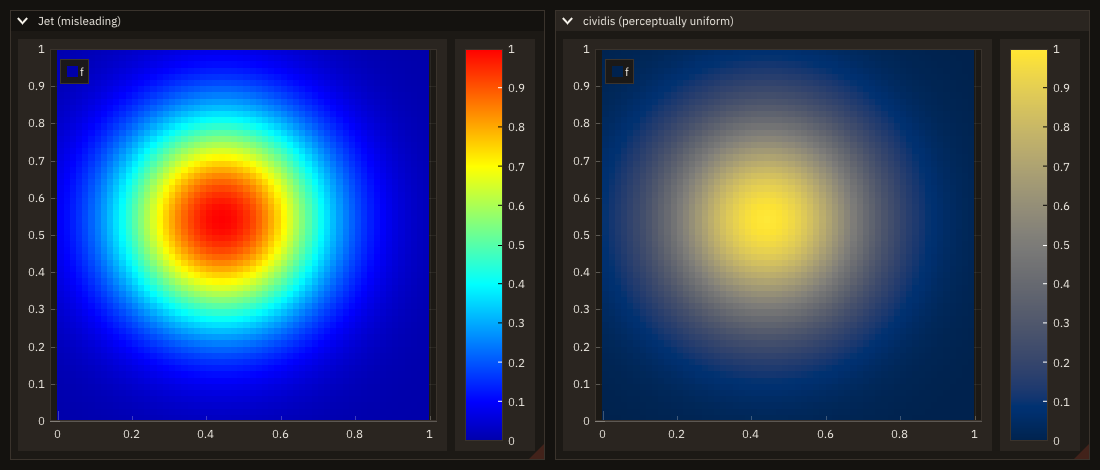
Jet (and other rainbows) changes lightness unevenly: it is darkest at its blue end, brightest in its yellow and cyan bands, darker again at the red end. The eye reads lightness as value, so a smooth field shows bands and edges where the data have none (the rings above), and the highest values look darker than those below them. Printed in greyscale, or seen with a red-green deficiency, the order of the colours is lost. Jet stays available ('Jet', for comparison with older pictures); FIGURE never uses it by default.
Discrete levels
levels cuts the map into that many bands of equal width, each with the map's colour at the band's centre, and no blending between them (ImPlot's qualitative kind): a heatmap then shows its contours as the edges between bands, and the colour bar shows the bands. levels is in [2, 256]. A diverging map with an even number of levels puts its reference value on an edge between two bands, with an odd number in the middle of one. Bands of a qualitative map (Deep) take its colours in order.
Reversed and discrete maps are registered under derived names: '<name>_r' and '<name>|<levels>'.
A colour-scale legend
| Procedure | Notes |
|---|---|
ip_colormap_legend(id, colormap, vmin, vmax [, levels] [, horizontal] [, width] [, height] [, label_format] [, scale] [, stat]) | A bar coloured by colormap from vmin to vmax, with ticks and their values: vertical (vmin at the bottom, values on the right) or horizontal=.true. (vmin at the left, values below); the ticks on scale (Scales). |
ip_colormap_legend_edit(id, colormap, vmin, vmax [, ...as above]) → logical | The same legend, whose range the user changes: dragged along the bar, zoomed by the wheel; vmin and vmax updated in place, .true. on the frame they change (Fields). |
if (ip_begin_plot('pressure', width=560.0_real64, height=420.0_real64, equal=.true.)) then
   call ip_setup_axes('x', 'y')
   call ip_heatmap('##p', p, -1.0_real64 - 0.5_real64 * h, 1.0_real64 + 0.5_real64 * h, -1.0_real64 - 0.5_real64 * h, &
                   1.0_real64 + 0.5_real64 * h, scale_min=-1.0_real64, scale_max=1.0_real64,                          &
                   colormap=ip_colormap('balance', levels=8_int32))
   call ip_contour('p', p, -1.0_real64, 1.0_real64, -1.0_real64, 1.0_real64, levels=[-0.5_real64, 0.0_real64, &
                   0.5_real64], color=line_color)
   call ip_end_plot()
endif
call ig_same_line()
call ip_colormap_legend('p levels', ip_colormap('balance'), -1.0_real64, 1.0_real64, levels=8_int32, &
                        height=420.0_real64)                    ! the bands of the heatmap, their edges labelled
call ig_text('the same map, continuous, horizontal:')
call ip_colormap_legend('p continuous', ip_colormap('balance'), -1.0_real64, 1.0_real64, horizontal=.true., &
                        width=560.0_real64, label_format='%.1f')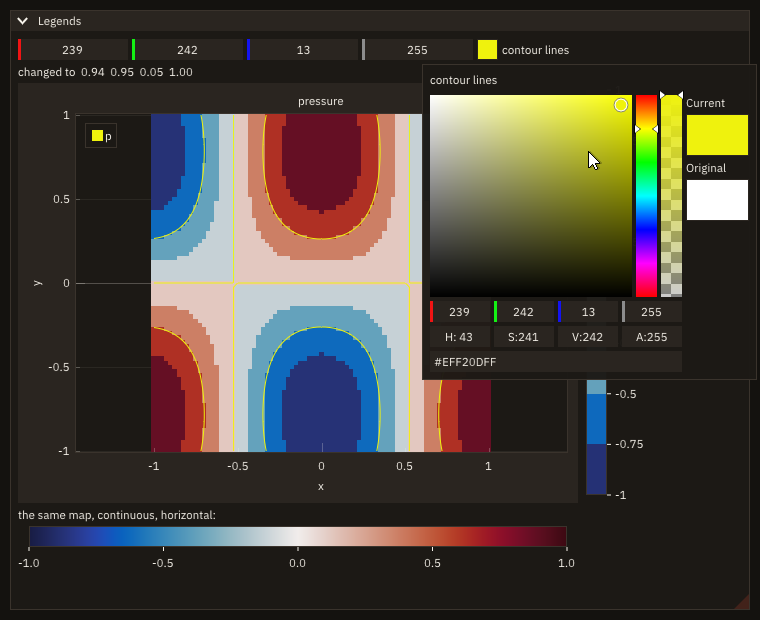
- An item of the window, not of a plot: put it beside a plot (
ig_same_line), above or below it, in a side bar, in any window.idtells legends of one window apart and is not shown. - Discrete levels. With
levels, the bar has that many bands of equal width, each the map's colour at its centre: the colours a heatmap drawn withip_colormap(name, levels)takes (Discrete levels); the ticks mark the bands' edges. Withoutlevels, the bar is continuous and the ticks fall on round values (steps of 1, 2, 2.5 or 5 times a power of ten), about every 40 pixels (100 when horizontal). Pass the continuous map's id withlevels, as the example does: the bands are computed from it. - The scale runs from
vmintovmax, the values a heatmap'sscale_minandscale_maxmap to the colormap's ends;vmin > vmaxturns it over. - Sizes [pixels]: positive, given; negative, the space left in the window; absent, the default: vertical, 300 long and as wide as the bar (a field's height) and the longest label; horizontal, the space left and as tall as the bar and a line of labels.
label_formatis a Cprintfformat (default'%g';''is the default too). A format with a conversion is checked: it must be one of a real (Formats); a format without one is text, printed as it is on every tick. - Band edges are labelled with their values. With
levels, an edge's label takes the digits it needs to show the edge's value:label_format's precision is raised until the number printed is the edge (to 6 decimals for%f, as a contour line's label ofip_contour; 7 significant digits for%eand%g). With'%.0f'and bands of 87.5, the edges read 87.5 beside contour lines labelled 87.5, not 88; round edges keep the format's digits ('%.0f': 100). The text around the number is kept ('%.0f K'). A format with nof,eorgconversion is used as it is. The continuous bar's ticks, at round values, uselabel_formatunchanged. - Bands and the bar sit on whole pixels, so neighbouring bands share their edge with no seam.
- The scale (
scale,'linear'by default,'log','symlog') places the ticks where a field drawn byip_field_imagewith the same scale puts the values' colours (Scales). The bar's colours do not change: the colormap runs evenly along it, its values do not. - Unlike
ip_colormap_scale(ImPlot'sColormapScale, vertical only, continuous colours), the legend is horizontal or vertical and shows discrete levels as bands. - Statuses:
FIG_ERR_ARGUMENTfor a colormap that is not registered,vminequal tovmaxor either not finite, either <= 0 on'log', an unknown scale,levelsoutside [2, 256], alabel_formatwith a conversion that is not one of a real ('%d','%s','%*f','%lf','%n','%f %f');FIG_ERR_STATEoutside a frame and from a task. - Modes: the same in window, headless and remote mode.
Scales
A colormap orders colours from 0 to 1; a scale says which value goes where. ip_field_image and the legends take the same three, those of a plot axis:
| Scale | A value v goes to the fraction | For |
|---|---|---|
'linear' | (v - vmin) / (vmax - vmin) | most quantities |
'log' | (log10 v - log10 vmin) / (log10 vmax - log10 vmin) | positive quantities over decades: a density, a residual, a spectrum's power. Values <= 0 have no place: a field shows them in its NaN colour; vmin and vmax must be above 0 |
'symlog' | the same with s(v) = 2 asinh(v/2) (ImPlot's symmetric log): linear near 0, logarithmic beyond about ±2 | signed quantities over decades: vorticity, a pressure coefficient, a difference between two runs. With a diverging map and vmin = -vmax, 0 sits in the middle |
On the legend, a log scale has its ticks at the decades (1, 10, 100; 2 and 5 times them too when the range holds fewer than two decades), a symlog scale at 0 and the signed decades; ticks too close for their labels are thinned (0 kept first, then the decades of largest magnitude, then the others). With levels, the band edges are equally spaced in the scale: on 'log' from 1 to 1000 in three bands, 1, 10, 100, 1000. The scale is in the units of the values: data spanning 1e-12 to 1e-9 on 'symlog' looks linear, since symlog's linear part reaches ±2 (scale the data first).
if (ip_begin_plot('density', 700.0_real64, 440.0_real64, equal=.true.)) then
   call ip_setup_axes('x [m]', 'y [m]')
   call ip_field_image('rho', rho, 0.0_real64, 4.0_real64, 0.0_real64, 3.0_real64, colormap=ip_colormap('inferno'), &
                       vmin=vmin, vmax=vmax, scale='log', changed=step)
   call ip_end_plot()
endif
call ig_same_line()
if (ip_colormap_legend_edit('rho legend', ip_colormap('inferno'), vmin, vmax, height=440.0_real64, &
                            scale='log', label_format='%g kg/m3')) then
   ! vmin and vmax changed: the next ip_field_image colours the field again
endif
if (ig_button('reset range')) then
   vmin = 0.1_real64
   vmax = 100.0_real64
endif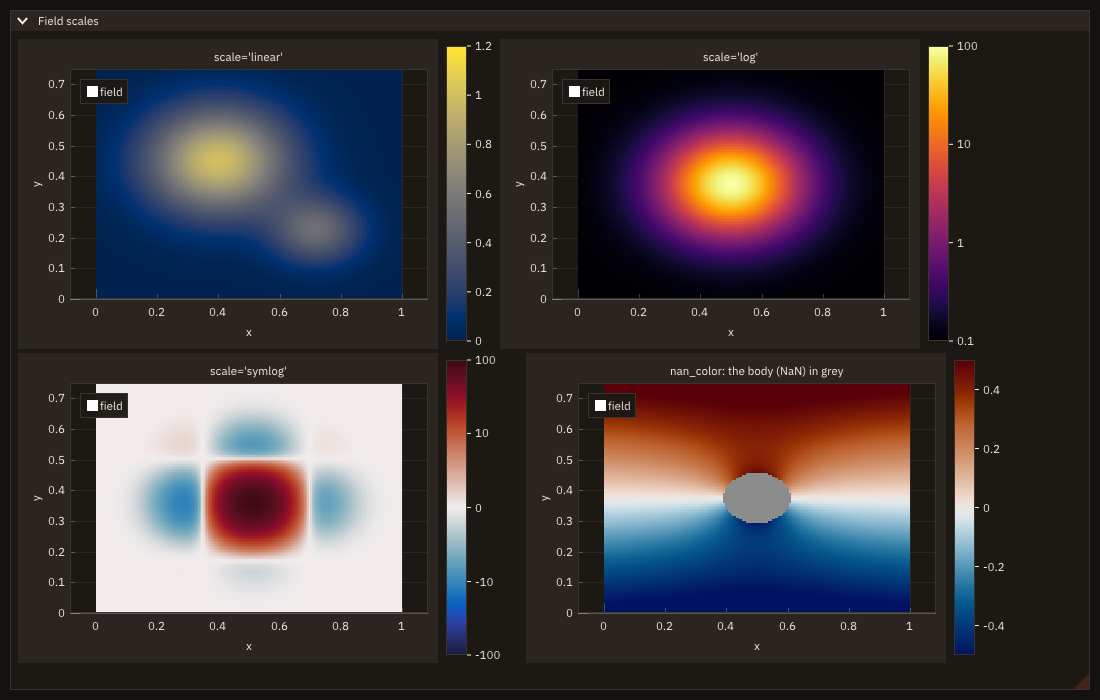
User maps
open(newunit=u, file='ocean.csv', status='replace', action='write') ! a user map: r, g, b rows in [0, 255]
write(u, '(A)') '# deep to shallow', '8,29,88', '37,52,148', '34,94,168', '29,145,192', '65,182,196', '161,218,180'
close(u)
call ip_load_colormap('ocean', 'ocean.csv', stat=stat)
if (stat /= FIG_OK) write(output_unit, '(A)') figure_last_error()if (ip_begin_plot('depth', width=300.0_real64, height=300.0_real64)) then
call ip_heatmap('d', abs(w), 0.0_real64, 1.0_real64, 0.0_real64, 1.0_real64, colormap=ip_colormap('ocean_r'))
call ip_end_plot()
endifip_load_colormap(name, file [, stat]) reads one of two formats, told apart by the first character of the file ([ or {: JSON):
- A CSV table: one colour a row,
r, g, b, separated by commas, semicolons, blanks or tabs. Components are in [0, 1], or in [0, 255] when one of them exceeds 1.#starts a comment, and a first line that is not numeric is a header (skipped). With four numbers a row,x, r, g, b, the first is the position of the colour (non-decreasing), and the map is resampled linearly to 256 uniform positions. From 2 to 65536 rows; the rows are the map's colours, first at the bottom of the scale. - A ParaView preset in JSON, as ParaView's "Export" of presets writes it (an array of presets) or one preset: the preset whose
Nameisname, or the only one. ItsRGBPoints(x, r, g, b, ...) are sampled at 256 uniform positions over their range, interpolated in itsColorSpaceas ParaView does:RGB,Lab(Lab/CIEDE2000is interpolated in Lab),Diverging(Moreland's method),HSV(the shorter way round the hue circle) orStep(each colour up to the next point).
A loaded map is kept for the program's life, across app%destroy and a new init*, and may be loaded before init*. Its name must be new: neither a map ip_colormap knows nor the reverse of one (ImPlot cannot replace a colormap), not empty, without |, and not starting with 'FIGURE ' (the prefix of the style's own line colours).
What is not read. From a ParaView preset, only Name, ColorSpace and RGBPoints: the colour of NaNs, the opacity points, the annotations and an indexed preset (IndexedColors, refused) are not. A \u escape in a JSON string is read as ?.
Editing a colormap
ig_gradient_edit(id, colormap) is a widget of the current window that edits a map by its stops: colours at positions in [0, 1], the map linear between them. It is ImGuizmo's ImGradient (vendored, with FIGURE's patch, THIRD_PARTY.md) with FIGURE's strip of the map above it.
if (ig_gradient_edit('stops', 'cool-warm', width=-90.0_real64)) text = 'cool-warm changed' ! the field follows
call ig_same_line()
if (ig_button('Save')) then
   call save('cool-warm', 'my-cool-warm.csv')
   text = 'saved to my-cool-warm.csv'
endif
if (ip_begin_plot('pressure', width=480.0_real64, height=440.0_real64, equal=.true.)) then
   call ip_setup_axes('x', 'y')
   call ip_field_image('p', p, -1.0_real64, 1.0_real64, -1.0_real64, 1.0_real64, colormap=ip_colormap('cool-warm'), &
                       vmin=-1.0_real64, vmax=1.0_real64)
   call ip_end_plot()
endif
call ig_same_line()
call ip_colormap_legend('p', ip_colormap('cool-warm'), -1.0_real64, 1.0_real64, height=440.0_real64)| The mouse | Does |
|---|---|
| drag a stop's square | moves the stop along the strip (it may pass others: the map takes the stops in order of position) |
| double click on the stops' row | adds a stop there, of the map's colour at that point |
| click a stop | selects it: its colour button and Remove appear on the right |
| the colour button | Dear ImGui's colour picker for the stop |
| Remove | removes the stop (a map keeps two) |
- Each change resamples the map from its stops, constant before the first and after the last: its table (256 colours for a bundled or loaded map; the keys of one of ImPlot's own) and every variant registered (
<name>_r,ip_colormap(name, levels)). Heatmaps, fields, legends and 3-D views drawn with the map show the new colours from the frame of the change on; fields and views are coloured again (their textures are cached by the map's colours too). The result is.true.on that frame. - The stops of a map not edited yet come from its colours: every key of a short table (ImPlot's own maps, a CSV of up to 16 rows); for a table of 256, some of its colours, each the farthest from the last between which the map is linear within 2 levels of 0-255 per channel: 10 to 21 stops for the bundled maps (
cool-warm: 13;turbo: 21). So the first change also moves the map's colours by at most 2 levels where the user did not touch it. - An edit lasts for the program's life: a new
init*registers the map again with its edited colours. Save it withip_colormap_stops, as a CSV ofx, r, g, brows, whichip_load_colormapreads back as the same map:
subroutine save(name, file)
!< The map's stops as a CSV table of `x, r, g, b` rows, which `ip_load_colormap` reads back as the same map.
character(len=*), intent(in) :: name          !< Colormap.
character(len=*), intent(in) :: file          !< CSV file.
real(real64), allocatable    :: positions(:)  !< Stops: positions in [0, 1].
real(real64), allocatable    :: colours(:,:)  !< ... their colours, RGB in [0, 1].
integer(int32)               :: u, k          !< Unit, counter.

call ip_colormap_stops(name, positions, colours)
open(newunit=u, file=file, status='replace', action='write')
write(u, '(A)') 'x, r, g, b'
do k = 1_int32, size(positions, kind=int32)
   write(u, '(F9.6,3(", ",F9.6))') positions(k), colours(:, k)
enddo
close(u)
endsubroutine save$ ./cb_gradient --test
cool-warm: 13 stops
its middle stop at 0.604, colour 0.950 0.791 0.711
dragged by 3% of the row, now at 0.633
after a double click: 14 stops
saved and read back: within 0 of 255 per channel- Which maps. Any continuous map: bundled, ImPlot's own, loaded. Not a reversed one (
<name>_r: edit<name>, the reverse follows), not a qualitative one (Deep, Dark, Pastel, Paired: lists of colours, no gradient). - Sizes [pixels]:
widthpositive given, else the space left plus it (default 0: all of it);heightthe strip and the stops' row together (default two rows of a frame). The selected stop's controls take the right end. - Statuses:
FIG_ERR_ARGUMENTfor an unknown name, a reversed or qualitative map;FIG_ERR_STATEoutside a frame (forip_colormap_stops: beforeinit*) and from a task. The same in window, headless and remote mode.
Statuses and modes
| Status | When |
|---|---|
FIG_ERR_ARGUMENT | ip_colormap: an unknown name, levels outside [2, 256]; ip_load_colormap: a malformed file (the message gives the line), a name taken or not allowed, a preset name not in a file of several; ip_heatmap, ip_colormap_scale: a colormap id that is not registered; ig_gradient_edit, ip_colormap_stops: an unknown name, a reversed or qualitative map |
FIG_ERR_FAILED | ip_load_colormap: the file cannot be read |
FIG_ERR_STATE | ip_colormap, ip_colormap_stops before init*, ig_gradient_edit outside a frame; any of them from a task |
stat is optional: absent, a failure stops the program with the message (error stop); present, it receives the status, and figure_last_error the message (Error handling).
cmap = ip_colormap('jet', stat=stat)                ! names are case-sensitive: ImPlot's is 'Jet'
if (stat /= FIG_OK) write(output_unit, '(A)') figure_last_error()$ ./cb_colormap
30 colormaps, the first ones:
balance, batlow, cividis, cool-warm, curl, deep
ip_colormap: unknown colormap 'jet' (ip_colormap_names lists them)Modes. The same in window, headless and remote mode: the colours are computed by the program, and the remote client receives the drawn cells.
Memory. ImPlot expands a continuous map of 256 colours into a lookup table of 65026 entries, about 254 KiB per map registered (a discrete map: its levels only). Registered at their first use, maps the program never asks for cost nothing.
Licences
The bundled tables keep their upstream licences, all permissive: CC0 and the matplotlib licence (cividis, inferno, magma, turbo; turbo also Apache-2.0), MIT (cmocean, Crameri's), BSD-3-Clause (ParaView's Cool to Warm). The licence files are installed under share/licenses/ and must travel with a program built with FIGURE; THIRD_PARTY.md gives each source, its version and what a distribution must carry. The tables are written by scripts/gen_colormaps.py from the pinned sources.