

Plots
figure_implot binds ImPlot (1.2 WIP): lines, markers, bars and shaded areas of real(real32) or real(real64) arrays, styled with ip_spec.
A plot
if (ip_begin_plot('Vibration modes', height=300.0_real64)) then
   call ip_setup_axes('x', 'amplitude')
   do k = 1_int32, M
      write(label, '(A,I0)') 'mode ', k
      call ip_line(trim(label), x, modes(:, k))
   enddo
   call ip_end_plot()
endif| Procedure | Notes |
|---|---|
ip_begin_plot(title [, width] [, height] [, equal]) → logical | .true. when the plot is visible. title is also the identifier: unique within the window. Default size: full width, ImPlot's default height. A negative height fills the space left in the window. equal=.true.: one unit spans as many pixels on x as on y (maps, the complex plane). |
ip_setup_axes(xlabel, ylabel [, auto_fit] [, xlog] [, ylog] [, xformat] [, yformat] [, xscale] [, yscale] [, stat]) | Labels of the axes X1 and Y1. Call it right after ip_begin_plot, before any item. The axes fit the data on first use, then follow the user's pan and zoom; with auto_fit=.true. they refit to the data every frame (a history that grows while the program runs) and the user cannot pan or zoom them. xscale/yscale: 'linear', 'log', 'symlog', 'time' (x only) (Axes); xlog=.true./ylog=.true. is the v0.3 spelling of 'log', kept. xformat/yformat: a C printf format of the tick labels ('%.4f', '%.2e', '%g s'), for values whose default labels look alike; checked (Formats). |
ip_setup_axes_limits(xmin, xmax, ymin, ymax [, always] [, stat]) | Initial ranges of X1 and Y1, applied on first use (the user pans and zooms afterwards), or every frame with always=.true.. Right after ip_begin_plot. |
ip_plot_limits(xmin, xmax, ymin, ymax [, xaxis] [, yaxis] [, stat]) | The axis ranges as the user has panned and zoomed them, this frame: of the axes the items use now, or of xaxis/yaxis ('x2', 'y2' ...). After the ip_setup_* calls (it ends the setup phase). |
ip_plot_size(width, height) | The size of the plot's data area [pixels], e.g. to compute an image at the screen's resolution. |
ip_line(label, x, y [, spec] [, stat]) | A line through (x(i), y(i)). label is the legend entry. |
ip_end_plot() | Only when ip_begin_plot returned .true.. |
Unlike ig_begin/ig_end, the plot pair is conditional: call ip_end_plot inside the if (an ip_end_plot after a false begin, or with another scope innermost, is refused and reported: Pairing and frames). A title that starts with ## hides the title and keeps the identifier. The first plot below also shows that ip_setup_axes is optional: without it the axes X1 and Y1 have no label, a linear scale, and fit the data on first use.
if (ip_begin_plot('##first mode', height=200.0_real64)) then
   call ip_line('mode 1', x, modes(:, 1))
   call ip_end_plot()
endif
The user can pan (drag), zoom (wheel, or drag a box with the right button), autofit (double-click), and hide a line by clicking its legend entry; these are ImPlot's interactions, kept by ImPlot from frame to frame.
Items
Every item is generic over real(real32) and real(real64) (all its arrays of the same kind), takes a legend label, an optional spec and an optional stat; the 1-D items read arrays of any stride in place (Data in place lists them). Integer abscissae, integer(int32) or integer(int64) (iterations), are taken by ip_line(label, x, y), ip_scatter, ip_bars, ip_shaded, ip_error_bars, ip_stairs and ip_stems, integer positions by ip_inf_lines; not by ip_digital, ip_bubbles, ip_pie_chart, ip_bar_groups or the histograms, whose arrays are real.
| Procedure | Draws |
|---|---|
ip_line(label, x, y [, spec] [, stat]) | a line through (x(i), y(i)) |
ip_line(label, y [, xscale] [, xstart] [, spec] [, stat]) | a line through y(i) at x = xstart + (i - 1) xscale (defaults 1 and 0) |
ip_line(label, y, row [, xscale] [, xstart] [, spec] [, stat]) | a line through the row row of the matrix y, read in place with a stride (no copy) |
ip_scatter(label, x, y [, spec] [, stat]) | markers at (x(i), y(i)) (a circle when spec sets no marker) |
ip_bars(label, x, y, bar_size [, spec] [, stat]) | bars of height y(i) centred at x(i), bar_size wide in x units (real(real64), required: ImPlot has no default for it) |
ip_shaded(label, x, y1, y2 [, spec] [, stat]) | the area between the curves y1(x) and y2(x) |
ip_shaded(label, x, y, yref [, spec] [, stat]) | the area between the curve y(x) and the line y = yref (real(real64)) |
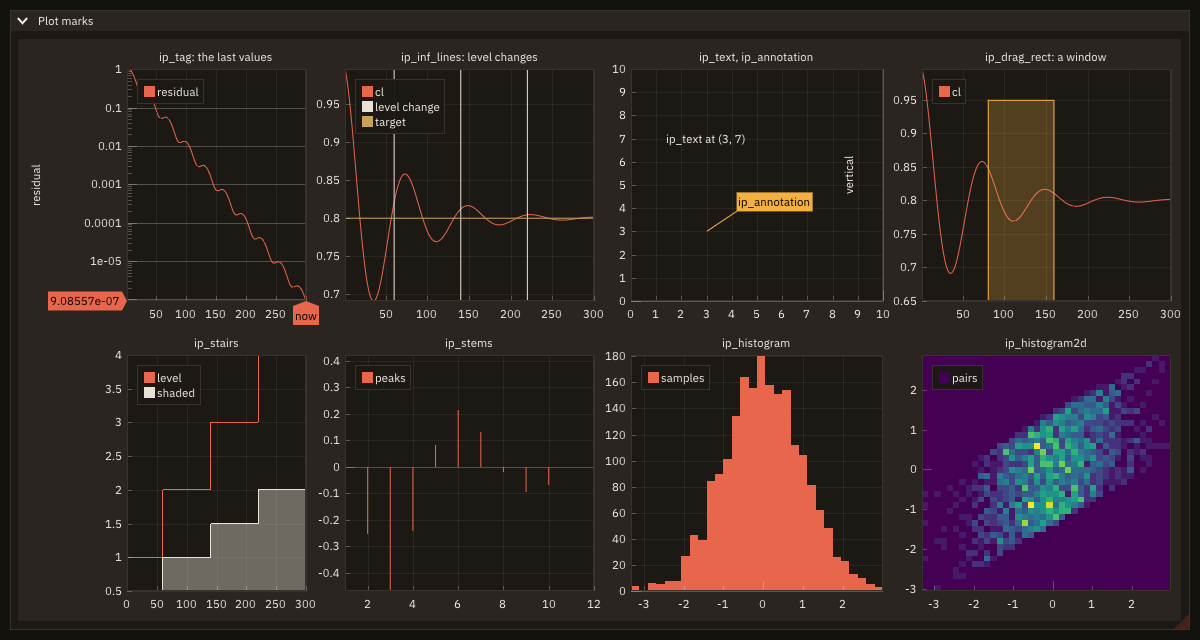
ip_stairs(label, x, y [, spec] [, stat]) | a staircase (PlotStairs): y(i) held from x(i) to x(i+1); with ip_spec(flags=ImPlotStairsFlags_PreStep) from x(i-1) to x(i), with ImPlotStairsFlags_Shaded filled down to 0 |
ip_stems(label, x, y [, ref] [, spec] [, stat]) | a stem from y = ref (real(real64), default 0) to each point, with a marker (PlotStems); ImPlotStemsFlags_Horizontal from x = ref |
ip_inf_lines(label, values [, horizontal] [, spec] [, stat]) | lines across the whole plot (PlotInfLines) at x = values(i), or at y = values(i) with horizontal=.true. (the same as ip_spec(flags=ImPlotInfLinesFlags_Horizontal)); values may also be integer(int32) or integer(int64) (iterations) (Marks in a plot) |
ip_histogram(label, values [, bins] [, vmin] [, vmax] [, bar_scale] [, max_count] [, spec] [, stat]) | a histogram (PlotHistogram) (Histograms) |
ip_histogram2d(label, x, y [, xbins] [, ybins] [, xmin] [, xmax] [, ymin] [, ymax] [, colormap] [, max_count] [, spec] [, stat]) | a 2-D histogram (PlotHistogram2D), cells coloured by count (Histograms) |
ip_digital(label, x, y [, spec] [, stat]) | a digital signal (PlotDigital): y(i) held from x(i) to x(i+1), drawn in a band of its own at the bottom of the plot whatever the y axis (Grouped bars and digital signals) |
ip_bar_groups(labels, values [, group_size] [, shift] [, horizontal] [, stacked] [, colormap] [, spec] [, stat]) | items in groups of bars (PlotBarGroups): values(g, i) is item i in group g, side by side or stacked (Grouped bars and digital signals) |
ip_bubbles(label, x, y, radii [, spec] [, stat]) | circles at (x(i), y(i)) of radius radii(i) in plot units (PlotBubbles) (Pies and bubbles) |
ip_pie_chart(labels, values, x, y, radius [, label_format] [, angle0] [, normalize] [, colormap] [, spec] [, stat]) | a pie chart, one slice per value, centred at (x, y) (PlotPieChart) (Pies and bubbles) |
call ip_shaded('spread', x, y - s, y + s)                                ! band between two curves
call ip_line('signal', x, y, spec=signal)                                ! styled line
call ip_scatter('samples', x(::5), y(::5), spec=samples)                 ! markers only
call ip_bars('counts', real(x, real32), counts, 0.15_real64)             ! real32 data, bar width in x units
call ip_shaded('to zero', x, y, 0.0_real64, spec=ip_spec(fill_alpha=0.25_real64))    ! curve to y = 0
call ip_scatter('squares', x(1:3), y(1:3), spec=ip_spec(marker=ImPlotMarker_Square))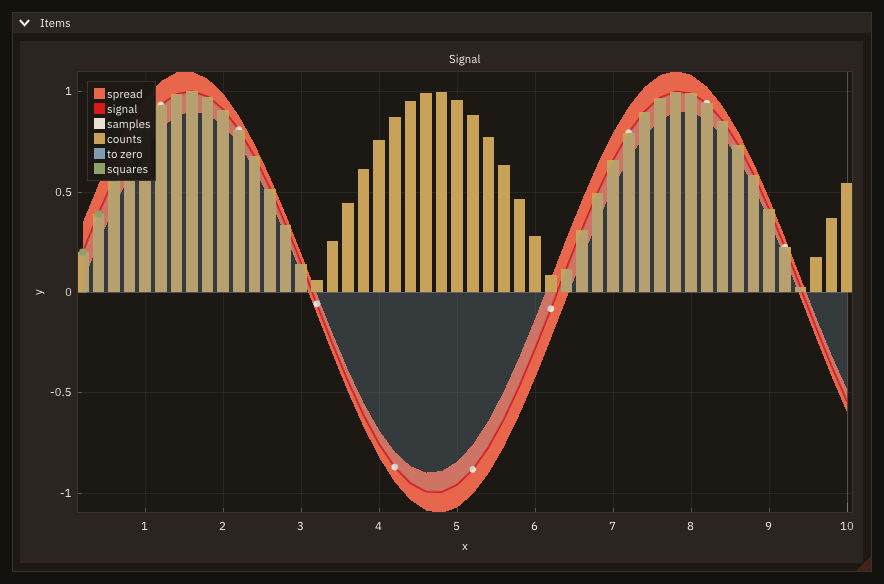
The two ip_shaded forms are told apart by the fourth argument: an array (y2) or a scalar (yref). Items are drawn in the order they are called, each above the previous ones. The gallery below draws each of the newer items and marks with its call (Marks in a plot):
A label is the item's id in its plot (ImPlot hashes it, GetItemID): two items of one plot with one label are one item, with one colour and one legend entry, hidden together by a click on it. A loop that calls ip_line('run', ...) for each of several runs draws them all in one colour under one entry; give each its own label, as the loop over the modes in A plot does (write(label, '(A,I0)') 'mode ', k). What follows ## is part of the id and not of the legend: 'run##2' is another item whose entry reads run, and a label that starts with ## ('##cursor') has no legend entry. The same label in two plots names two items.
Fields are items too: ip_heatmap colours the cells of a 2D array through a colormap, and ip_colormap_scale draws its colour bar (Heatmaps); the colormap is chosen by name with ip_colormap, among the bundled scientific maps, ImPlot's own and the user's (Colormaps).
Grouped bars and digital signals
ip_bar_groups draws several items over the same categories, values(g, i) being item i in group g (so size(labels) == size(values, 2)): group g (a case, a block) at x = g - 1 + shift (shift [x units], default 0), its items (the phases of a run) side by side within group_size of the unit (default 0.67), or stacked with stacked=.true. (negative values below 0); horizontal=.true. lays the groups along y. labels(i) is item i's legend entry, its colour the plot's next line colour, or colormap's i-th (an id of ip_colormap); spec's fill_color paints them all. The values are copied once, item by item, in the order ImPlot reads them.
if (ip_begin_plot('cost per case', height=170.0_real64)) then  ! group g: case g; item i: phase i
   call ip_setup_axes('case', 'seconds')
   call ip_bar_groups(PHASE, COST, group_size=0.7_real64)
   call ip_end_plot()
endif
if (ip_begin_plot('cost per case, stacked', height=170.0_real64)) then
   call ip_setup_axes('case', 'seconds')
   call ip_bar_groups(PHASE, COST, stacked=.true.)
   call ip_end_plot()
endif
ip_digital draws a state over time: 0 and 1 as low and high, larger values as taller steps (a solver writing its output, a valve open), held from one abscissa to the next, in a band at the bottom of the plot that the y axis does not scale: it sits under a residual whatever the residual's range. Its x values take part in fitting x, its y values in nothing; spec's size is the band's height. x and y are real, read in place with any stride (Data in place). ImPlot draws the band with FIGURE's one-line patch (native/patches/implot-0001-digital-rect-order.patch): unpatched, ImPlot 1.2 WIP gives each rectangle its top below its bottom, which Dear ImGui 1.93 draws as nothing (THIRD_PARTY.md).
if (ip_begin_plot('residual and output', height=-1.0_real64)) then
   call ip_setup_axes('iteration', 'residual')
   call ip_line('residual', it, res)
   call ip_digital('writing', it, writing)                  ! 0 or 1, drawn in a band of its own
   call ip_end_plot()
endif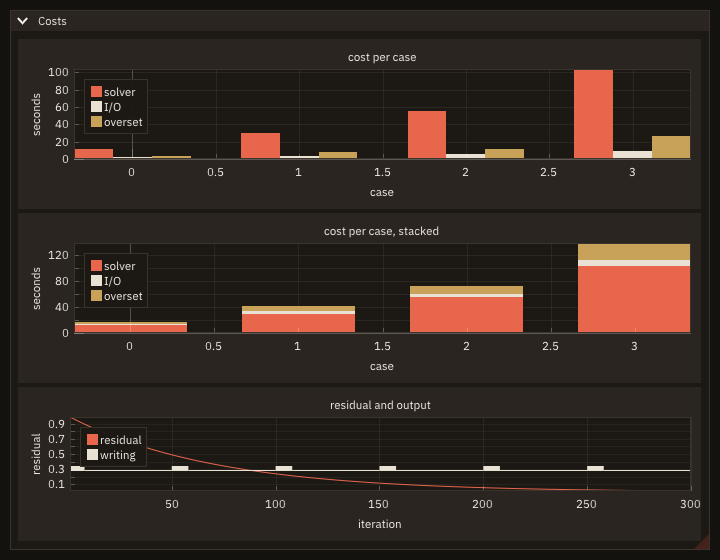
Recipes for this: Compare the cost of each phase across cases, Mark when the solver writes, under its residual.
- Statuses:
FIG_ERR_ARGUMENTforsize(labels)notsize(values, 2), no values,group_sizeoutside (0, 1], an unknown colormap, series of different sizes (ip_digital);FIG_ERR_STATEoutside a plot or from a task.
Pies and bubbles
ip_pie_chart(labels, values, x, y, radius) draws one slice per value, its label in the legend (each slice is a legend entry), centred at (x, y) with radius, all in plot units: give the plot equal=.true. to keep it round. The slices start at angle0 degrees (default 90, the top) and go clockwise. Values summing to 1 or more fill the circle; a sum below 1 draws them as fractions of one, a partial circle, unless normalize=.true., which always fills it. Each slice shows its value in the printf format label_format (default '%.1f', '' none). The slices take the colours of the plot's colormap in order, or of colormap (ip_colormap): a spec's colours do not apply to them. values is real(real32) or real(real64), 0 or more.
ip_bubbles(label, x, y, radii) draws a circle at each point, radii(i) in plot units along both axes: round on equal axes, an ellipse where the axes' scales differ. It is filled with the item's fill colour and outlined with its line colour (ip_spec(fill_alpha=0.5_real64) lets the overlaps show); the axes fit the circles, centres and radii.
if (ip_begin_plot('one run', width=280.0_real64, height=280.0_real64, equal=.true.)) then
   call ip_setup_axes('##x', '##y')
   call ip_pie_chart(['solver  ', 'I/O     ', 'overset ', 'boundary'], seconds, 0.5_real64, 0.5_real64, 0.45_real64, &
                     label_format='%.0f s', normalize=.true.)  ! the slices are fractions of the sum
   call ip_end_plot()
endifif (ip_begin_plot('blocks', width=300.0_real64, height=280.0_real64, equal=.true.)) then ! round on equal axes
call ip_setup_axes('x [m]', 'y [m]')
call ip_bubbles('cells', cx, cy, 0.5_real64 * sqrt(cells), & ! a radius in metres: an area as the cells
spec=ip_spec(fill_alpha=0.5_real64))
call ip_end_plot()
endif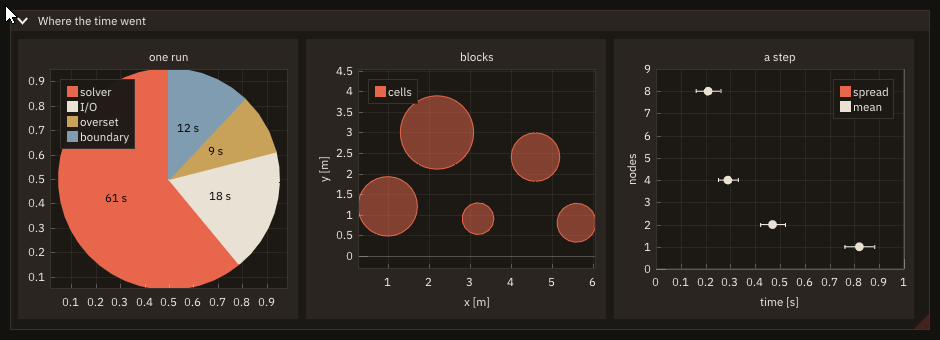
- Statuses:
ip_pie_chart:FIG_ERR_ARGUMENTfor labels not one per value, a radius not above 0, a value below 0 or not finite, a format that is not one real's, a colormap not registered;ip_bubbles:FIG_ERR_ARGUMENTfor series of different sizes; bothFIG_ERR_STATEoutside a plot and from a task.statis optional (absent:error stopwith the message). - Modes: the same in window, headless and remote mode (
src/tests/figure_test_plot_more.F90).
Axes
A plot has six axes: three x axes, 'x1', 'x2', 'x3', and three y axes, 'y1', 'y2', 'y3' (ImPlot's ImAxis_X1 ... ImAxis_Y3). X1 and Y1 always exist; the others exist on the frames a program sets them up. Each axis has its own range, scale, ticks and label, and fits its own data: residuals on a log scale and force coefficients on a linear one share the iterations in one plot.
if (ip_begin_plot('Convergence', height=-1.0_real64)) then
   call ip_setup_axis('x1', label='iteration')
   call ip_setup_axis('y1', label='residual', scale='log')
   call ip_setup_axis('y2', label='coefficient', format='%.2f') ! on the right, no grid lines
   call ip_setup_legend('e', outside=.true.)
   call ip_line('residual', it, residual)                       ! on X1, Y1
   call ip_set_axes('x1', 'y2')                                 ! the next items on Y2
   call ip_line('cl', it, cl)
   call ip_line('cd', it, cd)
   call ip_end_plot()
endif| Procedure | Notes |
|---|---|
ip_setup_axis(axis [, label] [, scale] [, auto_fit] [, format] [, opposite] [, invert] [, lock] [, no_grid] [, stat]) | Set up one axis (SetupAxis, SetupAxisScale, SetupAxisFormat). scale: 'linear' (default), 'log', 'symlog', 'time'. auto_fit: refit to the data every frame. format: the tick labels' printf format, checked (Formats). opposite: ticks and label on the other side (top, right); invert: values grow leftwards or downwards; lock: the user cannot pan or zoom it; no_grid: no grid lines. Axes 2 and 3 default to opposite and no_grid; X1 and Y1 to neither. |
ip_set_axes(x, y [, stat]) | The axes the next items use (SetAxes), until the next call or the plot's end: x one of 'x1', 'x2', 'x3', y one of 'y1', 'y2', 'y3'. Each plot starts on X1 and Y1. |
ip_setup_axis_limits(axis, vmin, vmax [, always] [, stat]) | Initial range of one axis (SetupAxisLimits), on first use or, with always=.true., every frame. |
ip_setup_axis_ticks(axis, values [, labels] [, stat]) | Ticks at values (real(real64), axis units) instead of the automatic ones (SetupAxisTicks), labelled labels (one per value, trailing blanks dropped) or, without them, by the axis's format. |
ip_setup_axis_constraints(axis [, vmin] [, vmax] [, zoom_min] [, zoom_max] [, stat]) | Bounds the user cannot pan or zoom past (SetupAxisLimitsConstraints, SetupAxisZoomConstraints): the range stays inside [vmin, vmax], its width inside [zoom_min, zoom_max] (axis units). An end not given keeps its bound: none, or the scale's (a log axis stays above 0). |
ip_setup_legend([location] [, outside] [, horizontal] [, stat]) | Where the legend goes (SetupLegend): location a compass point, 'n', 'ne', 'e', 'se', 's', 'sw', 'w', 'nw' (the default) or 'c' (centre); outside=.true. puts it outside the plot area on that side, and the plot area shrinks to make room; horizontal=.true. lays its entries in a row. |
ip_plot_limits(xmin, xmax, ymin, ymax [, xaxis] [, yaxis] [, stat]) | The ranges of the axes the items use now, or of xaxis and yaxis. |
test_plot_tick(axis, index, label [, count] [, stat]) | The tick labels of any axis, for tests (Testing): axis one of the six names ('x' and 'y': X1 and Y1). |
Which call addresses which axis. ip_setup_axes, ip_setup_axes_limits and the items before any ip_set_axes address X1 and Y1; every ip_setup_axis* call names its axis; the items address the pair of the last ip_set_axes. 'x' and 'y' are accepted for 'x1' and 'y1' wherever an axis is named.
Order and frames. As ImPlot asks, a plot has a setup phase and then its content, on every frame:
- right after a true
ip_begin_plot:ip_setup_axes,ip_setup_axis(an axis 2 or 3 exists only on the frames this is called for it), then for that axisip_setup_axis_limits,ip_setup_axis_ticks,ip_setup_axis_constraints(afterip_setup_axis: itsscaleresets the constraints, and the ticks take theformatin effect), andip_setup_legend; - then the items, with
ip_set_axesbetween them.
The first item, ip_set_axes, ip_plot_limits, ip_plot_size, test_plot_tick and the drag tools end the setup. A setup call after that, or outside a plot, is a usage error (FIG_ERR_STATE, message <procedure>: the setup of the plot is over (...) or <procedure>: no plot is being declared (...)); a call naming an axis not set up on this frame is one too (<procedure>: axis 'y2' is not set up (call ip_setup_axis('y2') first, on every frame)). Before v0.4.0 ImPlot's assertion aborted the program in these cases.
Scales.
'linear': the default.'log': base 10, ticks at the decades. A value <= 0 has no place on it: ImPlot draws it at the smallest positive double (10-308), far below the axis, so a line through it drops off the bottom; it does not take part in the fit, and the axis's range stays above 0 (avmin<= 0 inip_setup_axis_constraintsis refused).'symlog': symmetric log,2 asinh(v / 2): close to linear in [-1, 1], logarithmic beyond, for both signs (Cp, vorticity, a signed residual). Ticks at 0 and at the decades of each sign; near 0 the labels of ±1 and 0 can crowd.'time': x axes only (ImPlot locates time ticks on horizontal axes alone;'time'on a y axis is refused): values are UNIX seconds (real(real64)), labelled as dates and times in UTC (ImPlot's styleUseLocalTimeoff). ImPlot's time labels do not use the axis'sformat.
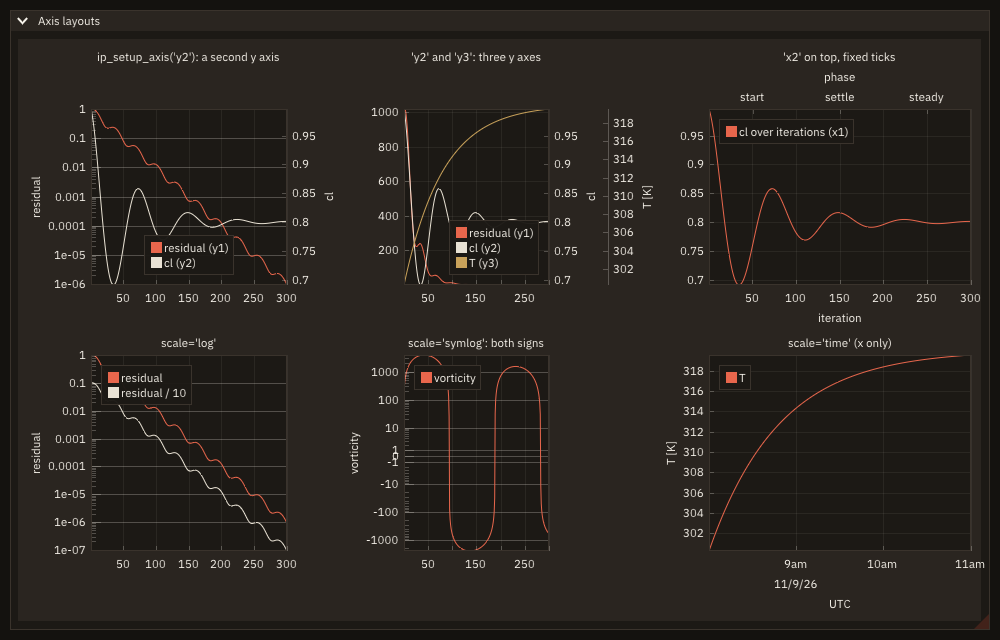
Fitting and the FPE rule. Each axis fits the items drawn on it, on first use (or every frame with auto_fit), and a double click fits again; X2 and X3 fit the abscissae of the items on them. An axis with nothing to fit, unused or set up with no item on it, keeps its range: ImPlot would compute inf - inf there (a NaN, which traps under -ffpe-trap=invalid), so ip_end_plot cancels the fit of every empty axis, and the first frame of a subplot figure asks every axis to fit and keeps only those with data. A plot that starts empty fits its items from the frame they arrive, on a log axis as on a linear one. A log axis fits only the positive values: values <= 0 have no place on it and are not drawn, and an axis whose items have no positive value keeps its range, as an empty one does.
Statuses: FIG_ERR_ARGUMENT, nothing set up, for an unknown axis, scale or location, an axis of the wrong direction in ip_set_axes or ip_plot_limits, 'time' on a y axis, a format refused, vmin >= vmax or a NaN end, ticks with labels not one per value or a value not finite, constraints with vmin >= vmax, zoom_min > zoom_max, a negative width, a NaN, or vmin <= 0 on a log axis, ip_setup_axes' xlog and xscale that disagree; FIG_ERR_STATE for the usage errors above and from a task. stat is optional: absent, an argument error stops with the message (error stop) and a usage error goes as app%set_checks says (Errors).
Modes: the same in window, headless and remote mode (the axes are laid out and drawn on the CPU; in remote mode the browser's pointer pans, zooms and drags the axes). Threads: a task does not draw (FIG_ERR_STATE).
What it does not do:
- custom scales (ImPlot's transform callbacks: no callbacks into Fortran), linked axes between plots other than subplots'
link_x/link_y, axis links to the program's variables (SetupAxisLinks); - keep the default ticks besides fixed ones (
SetupAxisTicks'show_default), or a tick formatter written in Fortran; - an axis 2 or 3 that persists by itself: it is set up on every frame, as everything in a plot;
- the legend of a subplot figure shared by its plots (
ImPlotSubplotFlags_ShareItems).
Changed in v0.4.0
ip_setup_axes takes xscale/yscale ('linear', 'log', 'symlog', 'time'). xlog/ylog stay as a synonym of 'log' (deprecated, to be removed in a later release): every v0.3.1 call compiles and draws as before; xlog=.true. with an xscale other than 'log' is refused. The new arguments come before stat: a call passing stat by position (none in FIGURE's examples) must name it. ip_setup_axes, ip_setup_axes_limits and ip_plot_limits outside a plot or after the setup are usage errors instead of ImPlot's assertion; ip_setup_axes_limits and ip_plot_limits take an optional stat. Subplot figures fit every axis in use on their first frame, not only X1 and Y1. test_plot_tick takes the six axis names.
Formats
Labels of numbers take a C printf format: the tick labels (ip_setup_axes' xformat and yformat), the values in a heatmap's cells and on its colour bar (label_format of ip_heatmap, ip_colormap_scale, ip_colormap_legend), and the number widgets (ig_input, ig_drag, ig_slider, ig_slider_angle, ig_drag_range: Numbers). The plots print reals, and FIGURE checks the format before Dear ImGui or ImPlot uses it:
- exactly one conversion of a real:
forF(fixed point),eorE(exponent),gorG(the shorter of the two),aorA(hexadecimal); - before the conversion letter, optional flags (
-left-justified,+sign always, a blank for a positive sign,#,0zero-padded), a width and a precision (.and digits), all as digits, never*; - any other text around it, and any number of
%%(a percent sign).
| Format | Prints 1234.5678 as | Resembles Fortran's |
|---|---|---|
'%.2f' | 1234.57 | F0.2 |
'%10.3f' | 1234.568 | F10.3 |
'%.3e' | 1.235e+03 | ES10.3 |
'%g' | 1234.57 | G0 (6 significant digits) |
'T = %.1f K' | T = 1234.6 K | 'T = ', F0.1, ' K' |
'%.0f%%' | 1235% | F0.0, '%' |
Refused with FIG_ERR_ARGUMENT (stat absent: error stop), nothing drawn: a conversion of an integer or of text ('%d', '%i', '%s'), %n, * ('%*f', '%.*f'), a length modifier ('%lf', '%Lg'), no conversion ('no conversion', '') or more than one ('%f %f'), a % at the end. One exception, kept from v0.3.0: ip_colormap_legend takes a label_format without conversion as text, printed as it is, and '' as its default (Colormaps). The message names the procedure, the argument and the format: ip_setup_axes: xformat '%s' is not a format of a real: one conversion %f, %e, %g or %a (or %F, %E, %G, %A) expected, with optional flags, width and precision (Errors).
The number widgets take a format of their value's family: a real's as above, and for int32 and int64 values one conversion d, i or u under the same rules ('%5d', '%d cells'); an int64's is written as an int32's, and FIGURE adds the length modifier C needs ('%lld'). A conversion longer than 24 characters is refused too (Dear ImGui copies it into a buffer of 32 bytes).
A format of the wrong family is refused before Dear ImGui sees it, and the program goes on (docs/examples/src/cb_stat.F90, run by the documentation's build, Errors):
if (ig_begin('Input')) then
   v = 0.5_real64
   edited = ig_input('Value', v, format='%d', stat=stat)    ! '%d' prints an integer: v is a real
   if (stat == FIG_ERR_ARGUMENT) write(output_unit, '(A,I0,A)') 'ig_input: stat = ', stat, &
                                                             ', "'//figure_last_error()//'"'
endif
call ig_end()
C's formatter reads the value as the format says, and a format that does not match it is undefined behaviour: before v0.3.1 a '%d' given for a real printed a wrong label, and a '%n' for a heatmap's labels stopped the program (%n in writable segment detected, glibc on Linux). The same in every mode: window, headless and remote.
Item style
ip_spec(...) returns a plot_spec_object: ImPlot's defaults (colours from the colormap, no markers on lines), with the properties you pass overridden. Build it once, outside the loop, or inline in the call.
signal = ip_spec(line_color=[0.85_real64, 0.10_real64, 0.10_real64, 1.0_real64], line_weight=2.0_real64)
samples = ip_spec(marker=ImPlotMarker_Circle, marker_size=3.0_real64)| Argument | Type | Meaning |
|---|---|---|
line_color | real(real64), 4 values | line colour, RGBA in [0, 1] (absent: automatic) |
line_weight | real(real64) | line weight [pixels]: lines, bar edges, marker outlines |
fill_color | real(real64), 4 values | fill colour of bars and shaded areas, RGBA |
fill_alpha | real(real64) | alpha multiplier of the fill colours |
marker | integer(int32) | marker shape: ImPlotMarker_None, _Circle, _Square, _Diamond, _Up, _Down, _Left, _Right, _Cross, _Plus, _Asterisk, _Vertical, _Horizontal, _Auto |
marker_size | real(real64) | marker radius [pixels] |
marker_line_color, marker_fill_color | real(real64), 4 values | marker outline and fill colours, RGBA |
size | real(real64) | error-bar whisker and digital-bar size [pixels] |
flags | integer(int32) | ImPlotItemFlags_NoLegend, _NoFit, and the item's own: ImPlotLineFlags_Segments, _Loop, _SkipNaN, _NoClip, _Shaded; ImPlotScatterFlags_NoClip; ImPlotBarsFlags_Horizontal; ImPlotStairsFlags_PreStep, _Shaded; ImPlotStemsFlags_Horizontal; ImPlotInfLinesFlags_Horizontal; ImPlotHistogramFlags_* (Histograms); combine with ior |
stat | integer(int32), out | FIG_ERR_ARGUMENT when a colour does not have 4 values |
The constants are ImPlot's own names, exported by figure; their values are generated from the cimplot metadata. plot_spec_object has no public components: a spec always starts from ImPlot's defaults, never from zeros (a zero line weight would draw nothing).
Several plots in one figure
if (ip_begin_subplots('##forces', 2_int32, 1_int32, height=-1.0_real64, link_x=.true.)) then
   if (ip_begin_plot('drag')) then
      call ip_setup_axes('time', 'Cx', yformat='%.4f')   ! the default would print -3781.31 on every tick
      call ip_line('Cx', t, drag)
      call ip_end_plot()
   endif
   if (ip_begin_plot('pitching moment')) then
      call ip_setup_axes('time', 'CMy')
      call ip_line('CMy', t, moment)
      call ip_end_plot()
   endif
   call ip_end_subplots()
endif| Procedure | Notes |
|---|---|
ip_begin_subplots(title, rows, cols [, width] [, height] [, link_x] [, link_y]) → logical, ip_end_subplots() | A grid of plots; the plots inside it (ip_begin_plot/ip_end_plot) fill the cells row by row. End only after a true begin. |
ip_begin_subplots opens a grid of rows x cols plots in one figure, a drag and a moment history over one abscissa, and ip_end_subplots closes it, only after a true begin.
link_x(link_y): the plots share the x (y) range, so panning or zooming one moves all.- The first time a figure is drawn its plots fit to their data; linked axes then take the range of the last plot (the common abscissa, in practice). ImPlot itself gives linked axes no initial fit.
- Size as
ip_begin_plot: a negativeheightfills the space left; the default is 300 pixels per row.
Plots across plots
A grid of subplots shares one size and one window region. Plots that are each a figure of their own (a residual, a CFL number and the forces, each with its own height, legend and axes) are linked and aligned instead:
| Procedure | Notes |
|---|---|
ip_link_axis(axis, group [, stat]) | Links axis ('x1'..'y3') of the plot being set up to the group named group (SetupAxisLinks): the plots of a group show one range, and a pan or a zoom in any of them moves all. In the setup, every frame. |
ip_begin_aligned(group [, horizontal] [, stat]) → logical, ip_end_aligned([stat]) | The plots begun in between have their plot areas start and end at the same pixels whatever the width of their tick labels (BeginAlignedPlots): stacked plots line up their left and right edges, horizontal=.true. (side by side) their tops and bottoms. End only after a true begin; one group at a time. |
ip_legend_hovered(label [, stat]) → logical | .true. while the pointer is on the legend entry of the item label (IsLegendEntryHovered): a tooltip about the item. |
ip_begin_legend_popup(label [, button] [, stat]) → logical, ip_end_legend_popup([stat]) | A popup opened by a click of button ('right', default, 'left', 'middle') on the item's legend entry (BeginLegendPopup): when .true., draw its widgets, then end it. |
ip_hide_next_item([hidden] [, always] [, stat]) | Hides (default) or shows the next item (HideNextItem); its legend entry stays, greyed while hidden. Once, the first time the item is drawn, or with always=.true. on this frame whatever the user clicked: the program decides. |
if (ip_begin_aligned('history')) then                 ! the plot areas start at the same pixel
   if (ip_begin_plot('residual', height=160.0_real64)) then
      call ip_setup_axes('', 'residual')
      call ip_link_axis('x1', 'iteration')            ! pan or zoom one: the three follow
      call ip_line('residual', it, res)
      call ip_end_plot()
   endif
   if (ip_begin_plot('cfl', height=160.0_real64)) then
      call ip_setup_axes('', 'CFL')
      call ip_link_axis('x1', 'iteration')
      call ip_line('CFL', it, cfl)
      call ip_end_plot()
   endif
   if (ip_begin_plot('forces', height=-1.0_real64)) then
      call ip_setup_axes('iteration', 'coefficient')
      call ip_link_axis('x1', 'iteration')
      call ip_line('lift', it, cl)
      call ip_hide_next_item(.not. show_cd, always=.true.) ! the program decides, every frame
      call ip_line('drag', it, cd)
      if (ip_begin_legend_popup('drag')) then         ! a right click on the entry
         write(line, '(A,F7.4)') 'last value ', cd(N)
         call ig_text(trim(line))
         if (ig_checkbox('shown', show_cd)) continue
         call ip_end_legend_popup()
      endif
      if (ip_legend_hovered('lift')) then               ! the pointer on the entry
         if (ig_begin_tooltip()) then
            call ig_text('lift: the force normal to the flow, over q S')
            call ig_end_tooltip()
         endif
      endif
      call ip_end_plot()
   endif
   call ip_end_aligned()
endifA recipe for this: Stack plots over one iteration axis.
- A group's first frame. ImPlot gives linked axes no initial fit. FIGURE keeps each group's range itself (a Fortran program names a group, it keeps no variables with a fixed address for ImPlot), and a new group is not linked on its first frame: each of its plots fits its own data there, and from the next frame the group takes the range of the first plot that named it. Groups live as long as the application; a new
initstarts without them. - Aligned, not linked.
ip_end_alignedcloses the groupip_begin_alignedopened, only after a true begin. Alignment is about pixels, linking about values: plots over different abscissae can be aligned, and linked plots in different windows are not aligned. - Legends.
ip_begin_legend_popupopens a popup on an item's legend entry (its last value, a checkbox, a colour) andip_end_legend_popupcloses it, only after a true begin. The hover and the popup are asked after the item is drawn, beforeip_end_plot; the popup is a window of its own, its widgets drawn in it (a tooltip fromip_legend_hoveredlikewise, withig_begin_tooltip). A left click on an entry still hides its item, as ImPlot does;ip_hide_next_item(..., always=.true.)overrides it each frame. - Statuses:
FIG_ERR_ARGUMENTfor an unknown axis, an empty group name, an unknown button;FIG_ERR_STATEoutside a plot,ip_link_axisafter the setup,ip_begin_alignedinside another group, an end with nothing open (as the other pairs), from a task.
Error bars, annotations and drag tools
| Procedure | Notes |
|---|---|
ip_error_bars(label, x, y, err [, err_high] [, spec] [, horizontal] [, stat]) | Error bars (PlotErrorBars) at (x(i), y(i)), from y(i) - err(i) to y(i) + err(i), or to y(i) + err_high(i) when given (asymmetric); with horizontal=.true., along x instead, err in x units. Generic over real(real32) and real(real64), read in place as the other items. The whisker width is ip_spec(size=) [pixels]. |
ip_annotation(x, y, text [, color] [, offset] [, stat]) | A text (Annotation) at the plot point (x, y), drawn when the plot ends, over the items, kept inside the plot area. Without color: the text alone in the plot's text colour; with it: in a box of that colour (RGBA in [0, 1]), the text black or white for contrast. offset: [dx, dy] [pixels], x right, y down, with a leader line to the point; a zero component centres the text on the point along that axis (the default). |
ip_drag_line_x(id, x [, color] [, thickness] [, stat]) → logical | A vertical line at x that the user drags along x (DragLineX). x (real(real64)) is updated in place; .true. in the frames it moves. thickness [pixels], default 1. |
ip_drag_line_y(id, y [, color] [, thickness] [, stat]) → logical | A horizontal line at y, dragged along y (DragLineY). |
ip_drag_point(id, x, y [, color] [, radius] [, stat]) → logical | A point dragged in both directions (DragPoint); radius [pixels], default 4. |
Timings with their spread along x, horizontal=.true. (the third plot of Pies and bubbles):
if (ip_begin_plot('a step', width=300.0_real64, height=280.0_real64)) then
   call ip_setup_axes('time [s]', 'nodes')
   call ip_setup_axes_limits(0.0_real64, 1.0_real64, 0.0_real64, 9.0_real64)
   call ip_setup_legend('ne')                                           ! the fastest timing is top left
   call ip_error_bars('spread', step, nodes, spread, horizontal=.true.) ! spread is in x units: seconds
   call ip_scatter('mean', step, nodes)
   call ip_end_plot()
endifif (ip_begin_plot('around a body', width=520.0_real64, height=330.0_real64, equal=.true.)) then
call ip_setup_axes('x', 'y')
call ip_setup_axes_limits(0.0_real64, 2.0_real64, 0.0_real64, 1.0_real64)
call ip_contour('g', g, 0.0_real64, 2.0_real64, 0.0_real64, 1.0_real64, & ! NaNs: a hole, no lines
levels=[-0.8_real64, -0.6_real64, -0.4_real64, -0.2_real64, 0.2_real64, 0.4_real64, &
0.6_real64, 0.8_real64], colormap=cmap, line_weight=2.0_real64)
if (ip_drag_line_x(1_int32, probe_x)) probe_x = min(2.0_real64, max(0.0_real64, probe_x)) ! moved: clamp it
if (ip_drag_point(2_int32, px, py, radius=6.0_real64)) then
px = min(2.0_real64, max(0.0_real64, px))
py = min(1.0_real64, max(0.0_real64, py))
endif
i = 1_int32 + nint(px / DX, int32)
j = 1_int32 + nint(py / DY, int32)
if (ieee_is_nan(g(i, j))) then
text = 'inside the body'
else
write(text, '(A,F6.3)') 'g = ', g(i, j)
endif
call ip_annotation(px, py, trim(text), color=[1.0_real64, 1.0_real64, 0.9_real64, 0.9_real64], &
offset=[12.0_real64, -12.0_real64])
call ip_annotation(1.0_real64, 0.5_real64, 'NaN')
call ip_end_plot()
endifi = 1_int32 + nint(probe_x / DX, int32)
ey = y(1::10)
eg = g(i, 1::10)
write(text, '(A,F5.3)') 'g along x = ', (i - 1) * DX
if (ip_begin_plot(trim(text)//'###profile', width=1060.0_real64, height=-1.0_real64)) then
call ip_setup_axes('y', 'g')
call ip_setup_axes_limits(0.0_real64, 1.0_real64, -1.1_real64, 1.1_real64)
call ip_line('g', g, i, xscale=DY) ! row i, in place; NaNs: a gap
call ip_error_bars('samples, +/- 0.05', ey, eg, ee, spec=ip_spec(size=6.0_real64))
call ip_end_plot()
endif- Call them between
ip_begin_plotandip_end_plot, after the setup (ip_setup_axes*). idtells the drag tools of one plot apart: any integer, unique among them. The drag tools are not items: they have no legend entry, but their positions take part in fitting the axes.- A drag tool only moves its variable; constraints are the program's: clamp the value when the result is
.true., as the example does. Withoutcolor, a drag tool is drawn in the style's text colour. - An annotation is not an item either: no legend entry, and it does not take part in fitting the axes.
- Statuses:
FIG_ERR_ARGUMENTfor a colour without 4 components, an offset without 2, error-bar arrays of different sizes;FIG_ERR_STATEfor any of them outside a plot or from a task.statis optional (absent:error stopwith the message). A rectangle the user drags,ip_drag_rect, is in Marks in a plot.
Changed in v0.4.0
ip_drag_line_x, ip_drag_line_y and ip_drag_point outside a plot are usage errors (FIG_ERR_STATE, <procedure>: no plot is being declared (...)); until v0.3.1 they reached ImPlot's assertion and the program aborted.
- Modes: the same in window, headless and remote mode. In headless mode the drag tools answer synthetic input (
test_drag, Testing); in remote mode the browser's pointer drags them.
Marks in a plot
Marks are drawn in plot units and are not items, except the infinite lines: a tag on an axis, a line across the plot, a text at a point, a rectangle the user drags. With the drag tools and annotations of Error bars, annotations and drag tools they mark what a program wants seen.
| Procedure | Notes |
|---|---|
ip_tag(axis, value [, color] [, text] [, stat]) | A box on an axis at value (TagX, TagY): axis one of 'x1'..'x3', 'y1'..'y3', set up on this frame; it holds text or, without it, the value labelled as the axis labels its ticks (its format). color: RGBA in [0, 1], the text black or white for contrast; default, the colour of the last item drawn (a tag right after a line marks the line's last value in its colour). Drawn when the plot ends, over the axis's tick labels. |
ip_inf_lines(label, values [, horizontal] [, spec] [, stat]) | Lines across the whole plot area (PlotInfLines), vertical at x = values(i) or horizontal at y = values(i): an item, with a legend entry; values real(real32), real(real64), integer(int32) or integer(int64), read in place. |
ip_text(text, x, y [, offset] [, vertical] [, stat]) | A text centred on the plot point (x, y) (PlotText), in the plot's inlay text colour (ip_push_style_color('InlayText', ...) changes it), clipped to the plot area; offset: [dx, dy] [pixels], x right, y down; vertical=.true.: written bottom to top. It takes part in fitting the axes. |
ip_drag_rect(id, xmin, xmax, ymin, ymax [, color] [, stat]) → logical | A rectangle the user drags (DragRect): by its centre to move it, by a corner or an edge to resize it; the four real(real64) values updated in place, .true. in the frames it changes. |
call ip_plot_limits(xa, xb, ylo, yhi)                    ! the window spans the plot's height
if (ip_drag_rect(1_int32, x0, x1, ylo, yhi, color=AMBER)) then
   x0 = max(x0, 1.0_real64)                               ! kept on the data
   x1 = min(x1, real(N, real64))
endif
first = max(1_int32, ceiling(x0))
last = min(N, floor(x1))
if (last >= first) then
   mean = sum(cl(first:last)) / real(last - first + 1_int32, real64)
   call ip_line('mean', [x0, x1], [mean, mean], spec=ip_spec(line_color=AMBER, line_weight=2.0_real64))
   write(text, '(A,F6.4)') 'mean ', mean
   call ip_tag('y1', mean, color=AMBER, text=trim(text))
endif- A rectangle of the program's.
ip_drag_rectonly moves its variables: constraints are the program's (above, the window kept on the data and as high as the plot). ImPlot moves each edge on its own: dragged past the opposite edge,xminexceedsxmaxwhile the button is held; FIGURE puts them back in order when it is released. A rectangle of no width and no height cannot be grabbed. Its corners take part in fitting the axes.idas the other drag tools, unique among them in the plot. - Tags (
ip_tag) are drawn on the axis whichever axes the items use, after the plot's items, so a tag added late in the plot still lands on its axis. A tag outside the axis's range is not shown. A tag wider than the axis's tick labels widens the axis on the next frame, and the plot area shifts: a readout that follows the pointer writes a long value beside the point instead (ip_annotation), as the readout of Reading a plot does. - Infinite lines are not fitted: they take the axes' range, whatever it is.
- Texts (
ip_text) label a point of the plot (a probe, a peak): not an item, so no legend entry, but their point takes part in fitting the axes. - Order and frames. Between
ip_begin_plotandip_end_plot, after the setup (each ends it), on every frame they are to be seen. - Statuses:
FIG_ERR_ARGUMENTfor an unknown axis, a colour without 4 components, an offset without 2, a NaN value, coordinate or edge;FIG_ERR_STATEoutside a plot (<procedure>: no plot is being declared (...)), for an axis not set up, from a task.statis optional (Errors). - Modes: the same in window, headless and remote mode; the rectangle answers
test_dragheadless and the browser's pointer in remote mode. Threads: a task does not draw. - What they do not do: the tag's
roundoption and printf-formatted tags (TagX(x, col, fmt, ...): a Fortran program writes the text itself, as the example does); a text in a colour of its own other than through the style; the drag tools' flags (ImPlotDragToolFlags_*: no cursors, no fit, delayed, no move, no resize), andout_clicked,out_hoveredof the drag tools.
Contour lines
ImPlot has no contour lines: FIGURE computes them in Fortran (marching squares) and draws them as ImPlot line segments.
| Procedure | Notes |
|---|---|
ip_contour(label, f, x0, x1, y0, y1 [, levels] [, nlevels] [, colormap] [, color] [, labels] [, line_weight] [, stat]) | The contour lines of the field f(i, j) in the current plot. f is real(real32) or real(real64), read in place (any array, sections too). The segments are computed at every call and drawn as one line item per level, with one legend entry, label. |
ip_contour_lines(f, x0, x1, y0, y1, levels, x, y, first) | The same segments without drawing them, a pure subroutine (no GUI needed): x(:), y(:) (real(real64), allocatable) hold the segments' ends in pairs, level k's from first(k) to first(k+1) - 1 (integer(int64), allocatable, size(levels) + 1). |
ip_contour_levels(f [, count]) → real(real64) array | About count (default 10) levels at round numbers strictly inside the finite range of f: the multiples of a step of 1, 2, 2.5 or 5 times a power of ten, the smallest such step not below the range over count. None for a constant field, one with no finite value, or count < 1. pure. |
if (ip_begin_plot('over a heatmap', width=520.0_real64, height=330.0_real64, equal=.true.)) then
   call ip_setup_axes('x', 'y')
   ! the heatmap's bounds are the cells' outer edges: half a spacing beyond the first and last samples
   call ip_heatmap('##f', f, -0.5_real64 * DX, 2.0_real64 + 0.5_real64 * DX, -0.5_real64 * DY, &
                   1.0_real64 + 0.5_real64 * DY, scale_min=-1.0_real64, scale_max=1.0_real64, colormap=cmap)
   call ip_contour('f', f, 0.0_real64, 2.0_real64, 0.0_real64, 1.0_real64, levels=levels, &
                   color=[0.1_real64, 0.1_real64, 0.1_real64, 1.0_real64], labels=.true.)
   call ip_end_plot()
endif- Sampling.
f(i, j)is the value atx = x0 + (i - 1) (x1 - x0) / (size(f, 1) - 1)andy = y0 + (j - 1) (y1 - y0) / (size(f, 2) - 1):x0,x1,y0,y1are the positions of the first and last samples, as in a node-based grid. A heatmap takes the outer edges of its cells instead: to lay the lines over a heatmap of the same array, give the heatmap bounds half a spacing beyond the samples, as above. The grid is uniform along each axis; curvilinear and unstructured grids are not supported. - Levels.
levels(real(real64), any order) or, without it,ip_contour_levels(f, nlevels);nlevels< 1 is refused. - Colours. With
colormap(an id fromip_colormap) each level takes the map's colour at its value placed in the field's finite range, as a heatmap offwith the same map and no fixed scale colours it; withcolor(RGBA in [0, 1]) every level has that colour; with neither, the item's automatic colour.line_weight[pixels]. - Labels.
labels=.true.writes each level's value in a box of its colour on one of its segments (an annotation, drawn when the plot ends). The segment is taken part-way through the level's segments, a different fraction for each level, so the labels of nearby levels fall apart; they can still overlap where lines crowd. - The algorithm. Each cell of four neighbouring samples is cut by a level where linear interpolation along an edge gives it; a value equal to the level counts as above it. A saddle cell (two opposite corners above, the other two below) is resolved by its centre value, the mean of its corners: the corners on the centre's side are joined. A shared edge gives the same point in both its cells, so closed lines close.
- Holes. A cell with a NaN or an infinite corner is skipped: undefined regions (a body in a flow field, cells outside a domain) leave holes, not lines to spurious values.
- Cost.
ip_contourvisits every cell for every level at each call. For a large field that does not change, compute the segments once withip_contour_linesand draw each level withip_lineandip_spec(flags=ImPlotLineFlags_Segments). - Statuses:
FIG_ERR_ARGUMENTfor a colour without 4 components, a colormap that is not registered,nlevels< 1, or a level with more segment ends than a Cintcounts;FIG_ERR_STATEoutside a plot and from a task. - Modes: the same in window, headless and remote mode.
- Not done: filled contours (bands between levels: a heatmap of a discrete colormap,
ip_colormap(name, levels), shows them), smoothing of the lines, labels following the lines' direction.
Histograms
| Procedure | Notes |
|---|---|
ip_histogram(label, values [, bins] [, vmin] [, vmax] [, bar_scale] [, max_count] [, spec] [, stat]) | Bars over bins equal bins of [vmin, vmax], each as high as the values falling in it (PlotHistogram). values: real(real32) or real(real64). bins: a count > 0, or a rule, ImPlotBin_Sqrt (√n), ImPlotBin_Sturges (1 + log₂n, the default), ImPlotBin_Rice (2∛n), ImPlotBin_Scott (width 3.49 σ / ∛n). vmin/vmax (real(real64), both or neither): default the range of the finite values. bar_scale: bar width over bin width (default 1). max_count (out): the height of the tallest bar. |
ip_histogram2d(label, x, y [, xbins] [, ybins] [, xmin] [, xmax] [, ymin] [, ymax] [, colormap] [, max_count] [, spec] [, stat]) | Cells over [xmin, xmax] x [ymin, ymax] coloured through colormap (an id from ip_colormap, default Viridis) by the points falling in each (PlotHistogram2D); bins and ranges per axis as above; max_count (out): the fullest cell's count, the top of the colour scale (ip_colormap_scale draws it). |
if (ip_begin_plot("ip_histogram")) then
   call ip_histogram('samples', g, bins=30_int32)
   call ip_end_plot()
endif
if (ip_begin_plot("ip_histogram2d")) then
   call ip_histogram2d('pairs', g, g2, xbins=40_int32, ybins=40_int32)
   call ip_end_plot()
endif(g holds near-normal samples, sums of twelve Weyl sequences, and g2 a second set correlated with it: no random numbers, so the picture is the same on every run; docs/examples/src/gallery.F90.)
Flags, in ip_spec(flags=...): ImPlotHistogramFlags_Horizontal (bars along x, 1-D only), _Cumulative (each bar adds the ones before it, 1-D only), _Density (counts divided by the number of values and the bin width: the bars' area is 1), _NoOutliers (values outside the range do not count in a density or a cumulative sum).
- NaN and infinite values are left out (a temporary of the finite ones): ImPlot's counting compares them, an FPE under
-ffpe-trap=invalid. The default range is that of the finite values; a range of one value is made one unit wide around it. - Data in place.
ip_histogram2dreadsxandyin place with their stride, as the other items (Data in place).ip_histogramreads a contiguous array in place and copies a strided one, contiguous (test_plot_copiescounts it): ImPlot 1.2 WIP passes the values' stride on to the bars it draws from its own counts, which would read them at the wrong stride. - The bins are counted by FIGURE when a rule is given (ImPlot's formulas;
ImPlotBin_Scottwith a zero spread gives one bin, where ImPlot divides by zero), and the 2-D range is always given to ImPlot (ImPlot 1.2 WIP computes a missing x range wrong). - Statuses:
FIG_ERR_ARGUMENTforbins0 or belowImPlotBin_Scott, one end of a range without the other, a NaN end orvmin >= vmax, series of different sizes, a colormap not registered;FIG_ERR_STATEoutside a plot and from a task. - Modes: the same in window, headless and remote mode. Threads: a task does not draw.
- Not done: integer values (convert them to real), weights, bins of unequal width, the counts themselves (ImPlot keeps them;
max_countis the one it returns).
Fields
A field of a solver, f(i, j) on a grid, drawn through a colormap as one image: coloured into a texture once and drawn every frame for nothing, at any size. Up to a few hundred values a side a heatmap does the same with cells it rebuilds every frame (cell labels, cell edges); above that, and on a log or symlog scale, this is the call (Performance).
| Procedure | Notes |
|---|---|
ip_field_image(label, f, x0, x1, y0, y1 [, colormap] [, vmin] [, vmax] [, scale] [, nan_color] [, changed] [, range] [, stat]) | The field f (real(real32) or real(real64), rank 2, contiguous) over [x0, x1] x [y0, y1] of the current plot, f(i, j) the pixel in column i (along x) and row j (along y, j = 1 at y0): read in place, column-major as Fortran stores it. vmin, vmax: the values at the colormap's ends (default: the finite data's smallest and largest, positive ones on 'log'); scale: 'linear' (default), 'log', 'symlog'; nan_color: RGBA in [0, 1] of NaN and infinite values (default transparent); changed=.true.: the values changed since the last frame; range (out): the [vmin, vmax] the colours were computed for. |
ip_colormap_legend(id, colormap, vmin, vmax [, levels] [, horizontal] [, width] [, height] [, label_format] [, scale] [, stat]) | The colour-scale legend, its ticks on scale: an item of the window, beside the plot. |
ip_colormap_legend_edit(id, colormap, vmin, vmax [, ...as above]) → logical | The same legend whose range the user changes: drag along the bar to move it, the wheel to zoom it; vmin and vmax updated in place, .true. on the frame they change. |
Upstream: ImPlot draws the image (PlotImage); the colouring, the cache and the editable legend are FIGURE's, after ImPlotExtra.jl's image! and colorbar!.
if (ip_begin_plot('density', 700.0_real64, 440.0_real64, equal=.true.)) then
   call ip_setup_axes('x [m]', 'y [m]')
   call ip_field_image('rho', rho, 0.0_real64, 4.0_real64, 0.0_real64, 3.0_real64, colormap=ip_colormap('inferno'), &
                       vmin=vmin, vmax=vmax, scale='log', changed=step)
   call ip_end_plot()
endif
call ig_same_line()
if (ip_colormap_legend_edit('rho legend', ip_colormap('inferno'), vmin, vmax, height=440.0_real64, &
                            scale='log', label_format='%g kg/m3')) then
   ! vmin and vmax changed: the next ip_field_image colours the field again
endif
if (ig_button('reset range')) then
   vmin = 0.1_real64
   vmax = 100.0_real64
endif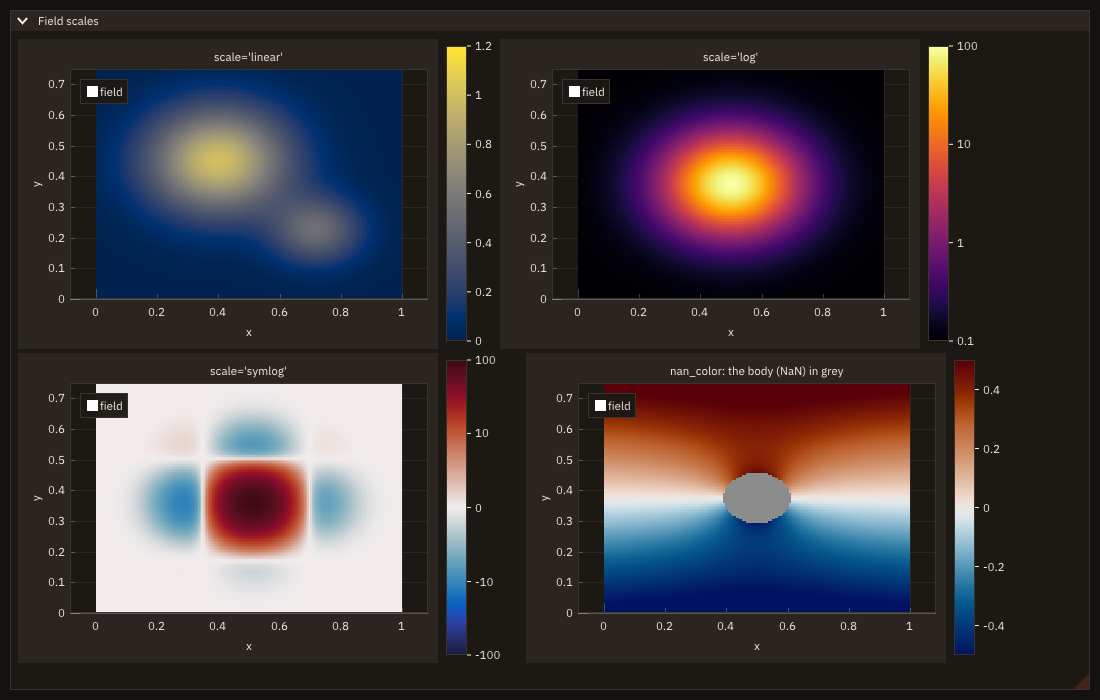
- When it is coloured. The texture is kept between frames, cached by the label in its plot (two fields of one plot need two labels). It is coloured again only when
changedis.true., or the array (its address, shape or kind),vmin,vmax,colormap,scaleornan_colordiffer from the last colouring; otherwise the frame draws the texture it has. FIGURE cannot see a change made in place: a time step that rewritesfpasseschanged=.true.on that frame (Known issues). A texture not drawn for 10 s is released; one drawn on every frame is kept, however long the program waits between frames (lazy redraw). - Colouring. A value maps to the fraction
t = (s(v) - s(vmin)) / (s(vmax) - s(vmin))of the colormap,sthe scale (log10, or ImPlot's symlog2 asinh(v/2), the same as a plot axis's), values beyondvminorvmaxclamped to the ends; the colour attis the one ImPlot samples (SampleColormap), the colours of a heatmap and of the legend.vmin > vmaxturns the map over. A field with no finite value is coloured over [0, 1] (log: [1, 10]); a constant field takes the colormap's middle. - Log scale and values <= 0. They are masked: drawn in
nan_color, as NaN is, not refused; the default range is that of the positive values. Avminorvmax<= 0 given with'log'is refused (FIG_ERR_ARGUMENT). Symlog takes every value: linear near 0, logarithmic beyond about ±2. - Speed. A 1024 x 1024 field is coloured in about 3 ms (linear, either kind; measured by
figure_test_fields, headless, on the development machine), plus the upload. Linear is coloured per pixel, exactly. Log and symlog, from 131 072 values up, go through a table indexed by the value's single-precision bits (ImPlotExtra.jl's trick, restricted to the range: at most 65 536 bins, each the colour of its centre), solog10andasinhrun 65 536 times instead of once per value: 4.7 to 9 times faster than per pixel, and the colours differ from the per-pixel ones by at most one step of the colormap's own table (1/255 per channel). Details: Performance. - Sizes. At most 16 384 values a side (a texture; GPUs commonly allow no more). A field drawn smaller than its values on the screen shows one of several values per pixel (nearest filtering): colour a field at the resolution it is shown, or reduce it first. An empty field draws nothing.
- The legend the user edits.
ip_colormap_legend_editmoves the range by the drag (the value under the pointer stays under it) and zooms it by 10% a wheel step about the value under the pointer, in the scale's space: on'log'by factors, so the range stays positive. It takes the wheel while the pointer is over it, so a scrolling window does not scroll. The newvminandvmax, passed toip_field_image, colour the field again on that frame. The program keeps its own reset (the button above). - Order and frames.
ip_field_imagebetweenip_begin_plotandip_end_plot, after the setup (it ends it, as any item), on every frame the field is to be seen; it is an item, with a legend entry, and fits the axes to its rectangle. The legends are items of the window, outside the plot (ig_same_lineputs them beside it). - Arguments. Edges in plot units, finite,
x0 /= x1,y0 /= y1(x0 > x1mirrors the image);vmin,vmaxfinite and different;nan_colorfour components in [0, 1];colormapan id fromip_colormap(default Viridis). - Statuses:
FIG_ERR_ARGUMENTfor an unknown scale ('time'included), avminorvmaxnot finite, equal, or <= 0 on'log', edges not finite or equal, anan_colorwithout 4 components or outside [0, 1], a colormap not registered, more than 16 384 values a side;FIG_ERR_STATEoutside a plot (ip_field_image: no plot is being declared (...)) and from a task.statis optional (Errors). - Modes: window, the texture on the GPU; headless, coloured and checked (the colours can be read back with
test_field_pixel, the colourings counted withtest_field_uploads, the textures kept counted withtest_field_textures, the last colouring timed withtest_field_time: Testing) but not drawn; remote, the texture goes to the browser through FIGURE's texture path (Remote): exact when coloured once, as JPEG while it is coloured on consecutive frames (a range dragged on the legend, a field changing every frame), exact again when it stops. Threads: a task does not draw. - What it does not do: see a change in place (
changed); interpolate between values (each value is a square of colour); non-uniform grids (the rectangle is divided evenly: map a stretched grid to its index space, or draw a heatmap); strided arrays (fis contiguous: the compiler copies a section into a temporary on every call, which also makes the address change, so such a field is coloured on every frame); a reset of the legend's range (the program's button); a time scale.
Reading a plot
A program reads where the user points in plot units (ip_plot_mouse, with ip_plot_hovered telling whether the pointer is over the plot's data area), converts between plot units and display pixels (ip_plot_to_pixels and its inverse ip_pixels_to_plot), and takes the box the user drags with the right button: the readout of a monitor, a window chosen by hand.
| Procedure | Notes |
|---|---|
ip_plot_hovered([stat]) → logical | The pointer is over the plot area (IsPlotHovered), on this frame. |
ip_plot_mouse(x, y [, xaxis] [, yaxis] [, stat]) | The pointer in plot units (GetPlotMousePos), wherever it is; -huge(1.0_real64) for both when there is no pointer (no mouse event yet). |
ip_plot_to_pixels(x, y, px, py [, xaxis] [, yaxis] [, stat]) | The display pixel of a plot point (PlotToPixels): px right from the display's left edge, py down from its top, as ig_item_rect and test_click take them. |
ip_pixels_to_plot(px, py, x, y [, xaxis] [, yaxis] [, stat]) | The plot point at a display pixel (PixelsToPlot). |
ip_plot_selection(xmin, xmax, ymin, ymax [, xaxis] [, yaxis] [, stat]) → logical | .true. on the frames the user drags a box with the right button (IsPlotSelected, GetPlotSelection), with its extent in plot units; 0 without one. |
ip_cancel_selection([stat]) | End that box without the zoom ImPlot applies when the button is released (CancelPlotSelection). |
hovered = ip_plot_hovered()
if (hovered) then
   call ip_plot_mouse(x, y)                               ! the pointer in plot units
   k = min(max(nint(x), 1_int32), N)                      ! the nearest iteration
   call ip_inf_lines('##cursor', [k], spec=cursor)        ! a line across the plot, at an integer
   call ip_scatter('##point', it(k:k), residual(k:k), spec=dot)
   write(text, '(ES9.2)') residual(k)
   call ip_tag('x1', it(k), color=AMBER)                  ! the iteration, as the axis labels it
   call ip_annotation(it(k), residual(k), trim(adjustl(text)), color=AMBER, &
                      offset=[40.0_real64, -24.0_real64])         ! the residual beside the dot
   shown = k
endif- Axes. Each call works on the axes the items use now (X1 and Y1, or those of the last
ip_set_axes), or onxaxis('x1','x2','x3') andyaxis('y1','y2','y3'), asip_plot_limitsdoes. - Pixels and plot units. Display pixels are
real(real64), ImPlot computes them in single precision (a pixel is afloat): a round trip through pixels keeps a value to a fraction of a pixel's width in plot units, not to its full precision. On a log axis a value <= 0 has no pixel: ImPlot places it at the smallest positive double. - The box selection. ImPlot's box: press the right button in the plot and drag;
ip_plot_selectionis.true.while the box is drawn, and on the release ImPlot zooms the axes to it (a locked axis keeps its range and the box spans it). A program that takes the box as its own choice (a window of iterations) reads it whileip_plot_selectionis.true.and callsip_cancel_selectionon the frame it takes it: the box ends there and the release zooms nothing. A left click while the right button is held cancels the box too (ImPlot's own key). - Order and frames. Between
ip_begin_plotandip_end_plot, after the setup: each of them ends the setup, as an item does (Axes). Valid on the frame they are called; the pointer is that of the frame. - Statuses:
FIG_ERR_ARGUMENTfor a name that is not an axis of its direction, a NaN coordinate or pixel;FIG_ERR_STATEoutside a plot (a usage error:<procedure>: no plot is being declared (...)), for an axis not set up, from a task.statis optional (Errors). - Modes: window, the same; headless, the pointer is the scripted one (
test_mouse_move,test_mouse_buttonwith'right'for a box, Testing); remote, the browser's pointer. Threads: a task does not draw. - What they do not do: report the pointer over an axis (
IsAxisHovered), over a subplot figure (IsSubplotsHovered) or over a legend entry; change the buttons ImPlot uses (GetInputMap, raw only).
A plot as a drop target
| Procedure | Notes |
|---|---|
ip_drop_target(type, payload [, axis] [, legend] [, x] [, y] [, stat]) → logical | Makes the plot a target of payloads of type type dragged from an ig_drag_source (BeginDragDropTargetPlot): .true. on the frame one is dropped, payload then holding it and x, y the point it landed on, in plot units (not set for the legend). With axis ('x1'..'y3', set up on this frame) only that axis receives (BeginDragDropTargetAxis), with legend=.true. only the legend (BeginDragDropTargetLegend). |
if (ip_begin_plot('residuals', height=-1.0_real64)) then
   call ip_setup_axes('iteration', 'residual', auto_fit=.true.)
   do c = 1_int32, CASES
      if (.not. shown(c)) cycle
      res = exp(-RATE(c) * it)
      call ip_line(trim(NAME(c)), it, res)
   enddo
   if (ip_drop_target('case', payload)) call show(payload, .true.) ! a case dropped here is plotted
   call ip_end_plot()
endif
A recipe for this: Drag a case onto a plot.
ip_drop_targetmakes the plot being declared (its area, one axis, or its legend) a target of drag and drop, asig_drop_targetmakes an item one; on the frame of a drop it also gives the point dropped at, in plot units. Called after the plot's items, beforeip_end_plot, on every frame. Several targets in one plot (its area, an axis) each receive what is dropped on their own part: a series dropped on the y2 axis can be plotted against it.- Statuses: those of
ig_drop_target, plusFIG_ERR_ARGUMENTfor an unknown axis or bothaxisandlegend,FIG_ERR_STATEoutside a plot or for an axis not set up.
Data in place
The 1-D items (ip_line, ip_scatter, ip_bars, ip_shaded, ip_error_bars, ip_stairs, ip_stems, ip_inf_lines, ip_digital, ip_bubbles, ip_histogram2d) read the program's arrays where they are, during the call, and keep no pointer to them afterwards. They go to ImPlot's float* or double* items with ImPlot's byte stride (ImPlotSpec::Stride), so an array does not have to be contiguous:
| What the program passes | Stride ImPlot reads with | Copied by FIGURE |
|---|---|---|
a whole array, a(1:n), a matrix column a(:, j) | the element size | nothing |
a(::2), a matrix row a(i, :), q(1, :, k), runs%cl (a component of an array of derived types) | the distance between two elements [bytes] | nothing, when x and the ordinates have the same stride |
x and y with different strides (ip_line(label, t, history(i, :))) | the stride of y | x, laid out at the stride of y |
integer abscissae, integer(int32) or integer(int64) (ip_line(label, runs%iter, runs%cl)) | the stride of y | x, converted to the kind of y |
a reversed section, a(n:1:-1) (negative stride) | the element size | every array of the item |
The ordinates (y, y1, err ...) set the stride: ImPlot has one stride for all the arrays of an item, so an array whose stride differs is copied, once per call, laid out at the ordinates' stride (as large as the ordinates' span: n times the stride). An item copies at most its abscissae when the ordinates share a stride. Integer abscissae are always converted (ImPlot reads x and y of one type); the ordinates stay in place. A reversed section is copied contiguous: ImPlot's indexer computes (size_t)idx * stride, which turns a negative stride into a wrapped-around unsigned offset, undefined behaviour in C++. test_plot_copies() counts the arrays FIGURE copied and test_plot_stride() gives the stride of the last item (Testing).
FIGURE copies into a scratch array per slot of the item (x, y and two more ordinates) and precision, kept from call to call and from frame to frame: grown by half again when too short, freed by the first item drawn after a frame in which no item copied. An item that allocated and freed its own temporary at every call paid the memory's first touch every frame (nvfortran 26.9 with glibc: 2.4 ms against 1.0 ms to copy 10⁶ doubles). The memory kept is that of the largest item copied, until a frame copies nothing.
Records of a run (runs%iter, runs%cl: components of an array of derived types) and the rows of a matrix, plotted where they are, with the copies counted (docs/examples/src/cb_in_place.F90, run headless by the documentation's build):
if (ip_begin_plot('Coefficients per iteration', height=280.0_real64)) then
   before = test_plot_copies()
   call ip_line('cl', runs%iter, runs%cl) ! integer x: converted; cl read where it is
   copies(1) = test_plot_copies() - before
   stride(1) = test_plot_stride()
   call ip_line('cd', runs%iter, runs%cd)
   call ip_end_plot()
endifif (ip_begin_plot('Probes', height=280.0_real64)) then
before = test_plot_copies()
call ip_line('probe 1', time, probes(1, :)) ! a row: time is copied at the row's stride
copies(2) = test_plot_copies() - before
stride(2) = test_plot_stride()
before = test_plot_copies()
call ip_line('probe 2', probes(2, :), xscale=1.0e-3_real64, xstart=1.0e-3_real64) ! uniform x: no copy
copies(3) = test_plot_copies() - before
stride(3) = test_plot_stride()
before = test_plot_copies()
call ip_line('probe 3, every 10th', probes(3, ::10), xscale=1.0e-2_real64, xstart=1.0e-3_real64)
copies(4) = test_plot_copies() - before
stride(4) = test_plot_stride()
call ip_end_plot()
endif$ ./cb_in_place --check
runs%iter, runs%cl: 1 copied, stride 8 bytes
time, probes(1, :): 1 copied, stride 24 bytes
probes(2, :), uniform x: 0 copied, stride 24 bytes
probes(3, ::10), uniform: 0 copied, stride 240 bytesWhat arrives is the compiler's choice. A Fortran compiler may copy a non-contiguous actual argument into a contiguous temporary before the call, and then FIGURE reads that copy (contiguous, nothing more to copy). The items' array dummies are asynchronous (from v0.5.0), and nvfortran then passes sections in place:
| Actual argument | gfortran 16.2 | nvfortran 26.9 | ifx 2026.2 |
|---|---|---|---|
a(::2), a(i, :), q(1, :, k) | in place | in place (v0.4.0: copied by the compiler) | in place |
a(n:1:-1) | in place, copied by FIGURE | in place, copied by FIGURE (v0.4.0: copied by the compiler) | in place, copied by FIGURE |
runs%cl (a component of an array of derived types) | copied by the compiler | copied by the compiler | in place |
(measured with figure_test_plot_data, which prints what each compiler passed). The plot is the same in every case; the cost is not.
Why asynchronous: nvfortran 26.9 copies a strided section passed to an assumed-shape dummy, except when the dummy is asynchronous (an attribute that tells the compiler the array may be in use by something else during the call, which a copy would break). The attribute changes nothing else: the items still read the arrays during the call only, and gfortran and ifx compile the same code. Passing sections in place is nvfortran's behaviour, not a rule of the standard for an assumed-shape dummy, so figure_test_plot_data holds what each supported compiler passes and fails when it changes: its last frame draws every 1-D item specific (both precisions, real and integer abscissae) with strided ordinates and checks the stride each gave ImPlot. A compiler FIGURE does not know is probed instead.
A component of an array of derived types is still copied
runs%cl, where runs is an array of a derived type, is copied into a temporary by gfortran 16.2 and nvfortran 26.9 at every call, whatever the dummy's attributes (C descriptors were measured too: nvfortran copies before it builds the descriptor, and gfortran 16.2 miscompiles a component passed to a bind(C) descriptor dummy). It costs 40 to 60 % of the item at 10⁶ points and doubles it at 10⁷. To plot a long series every frame on those compilers, keep it in its own contiguous real array, or in a column of a matrix (hist(:, j), contiguous). On nvfortran a pointer p => runs%cl is passed in place; gfortran 16.2 copies it too when runs is allocatable.
Measured cost of one ip_line per frame, headless, gfortran 16.2 -O2, i9-13900KF (ip_setup_axes_limits fixed, so ImPlot draws every point):
| Data | 100 000 points [ms/frame] | 1 000 000 points [ms/frame] |
|---|---|---|
contiguous x, y | 0.60 | 7.3 |
x(::2), y(::2), read in place with a stride | 0.69 | 7.8–8.2 |
integer x (converted), contiguous y | 0.62 | 7.8–8.3 |
contiguous x, y(::2) (x copied at the stride of y) | 0.77 | 8.9–9.5 |
runs%t, runs%cl (both copied by gfortran into temporaries) | 0.76 | 11.4–11.7 |
x(::2), y(::2) packed by the program into buffers allocated once | 0.71 | 9.6–10.0 |
Per compiler, v0.4.0 against v0.5.0: one ip_line call, the same headless program on each (median of 5 runs × 20 frames at 10⁶ points, 7 × 40 for the contiguous and reversed rows, 2 × 6 frames at 10⁷; the machine was shared, so the medians carry about ±0.5 ms at 10⁶):
| Data | nvfortran 26.9, 10⁶ [ms] | nvfortran 26.9, 10⁷ [ms] | gfortran 16.2, 10⁷ [ms] | ifx 2026.2, 10⁷ [ms] |
|---|---|---|---|---|
contiguous x, y | 8.5 → 8.5 | 73 → 70 | 70 → 69 | 75 → 72 |
a(1, :), a(2, :) (rows of a(4, n)) | 13.1 → 9.8 | 139 → 77 | 78 → 77 | 81 → 80 |
w(::2), v(::2) | 11.2 → 9.5 | 122 → 74 | 73 → 74 | 77 → 77 |
t(n:1:-1), c(n:1:-1) | 10.0 → 10.0 | 114 → 85 | 118 → 85 | 123 → 88 |
integer x (converted), contiguous y | 12.0 → 10.9 | 97 → 95 | 94 → 76 | 95 → 79 |
runs%t, runs%cl (copied by the compiler) | 12.5 → 12.8 | 137 → 143 | 150 → 148 | 81 → 80 (in place) |
nvfortran's rows and strided sections now cost what they cost on the other compilers. A reversed section costs what nvfortran's own copy cost at 10⁶ points (1.4 against 1.5 ms over contiguous data, 7 runs × 40 frames) and less at 10⁷, where the scratch saves the first touch of fresh memory on every compiler, as it does for integer abscissae.
ImPlot's own work dominates: a stride costs about 7 % over contiguous data, a copy made by FIGURE 20 %, the compiler's temporaries of a derived type's components 55 % (allocated and freed at every call). Over a few hundred thousand points, decimate before plotting (Performance).
Changed in v0.4.0
Until v0.3.1 the items' arrays were contiguous dummies: every non-contiguous actual argument (a(i, :), a(::2), runs%cl) was copied by the compiler at every call, and integer abscissae did not compile. From v0.4.0 the dummies are assumed-shape without contiguous and target, the stride goes to ImPlot, and ip_line, ip_scatter, ip_bars, ip_shaded and ip_error_bars accept integer(int32) and integer(int64) abscissae. Every v0.3.1 call compiles and draws as before. ip_line(label, y, row) stays: it reads a row of a contiguous matrix in place on every compiler, where ip_line(label, y(row, :)) depends on the compiler.
What it does not do:
- integer ordinates:
yisreal(real32)orreal(real64); - abscissae of one real kind and ordinates of the other: both
real(real32)or bothreal(real64); - the fields (
ip_heatmap,ip_contour) are rank-2 and keep their contract: a contiguous field is read in place, a section of one is copied by the compiler.
real(real32)/real(real64) passed as float/double rely on being the same types as real(c_float)/ real(c_double), true on every compiler FIGURE supports; their addresses are passed with c_loc of their first element, the stride from the addresses of the first two.
Series of different sizes are an error (FIG_ERR_ARGUMENT, message <item>: the series have different sizes, see Error handling): nothing is drawn. Empty series draw nothing and are not an error. An item outside a plot is a usage error (FIG_ERR_STATE, <item>: no plot is being declared (...)), in every checks mode; until v0.8.0 it reached ImPlot, which in modes 'report' and 'recover' dereferenced a null plot.
Modes: the same in window, headless and remote mode (the data become vertices on the CPU). Threads: a task does not draw (FIG_ERR_STATE, see processes). Example: Plot the history a solver keeps, in place.
3-D plots
figure_implot3d binds ImPlot3D (0.6 WIP): small 3-D figures that are plots, not scenes: probe positions, trajectories, a field as a height surface, a body as a few triangles, in a box with labelled axes and a legend, which the user turns with the mouse.
ImPlot3D or view3d_object? Both draw in 3-D; they are built for different sizes:
ip3_* (ImPlot3D) | view3d_object | |
|---|---|---|
| for | plots: lines, markers, surfaces and meshes over labelled axes, a legend | scenes: meshes coloured by fields, cuts, clipping planes, gizmos |
| size | up to about 10⁴ primitives (points, segments, triangles) | millions of faces |
| drawing | every primitive is a Dear ImGui triangle, sorted back to front each frame (no depth buffer): no intersecting surfaces | FIGURE's own rasterizer with a depth buffer: one image per frame |
| remote mode | every vertex sent to the browser each frame | one image per frame |
| lighting | none: flat colours | Lambert shading |
Take ImPlot3D for a figure that a 2-D plot would draw if it had a third axis; take view3d_object for geometry.
The items: ip3_line, a line through points; ip3_scatter, markers at them; ip3_surface, heights over a grid; ip3_mesh, triangles over shared vertices; ip3_triangles and ip3_quads, faces of three or four points in a row; ip3_image, a texture on a quadrilateral. ip3_text writes a label at a point of the box and is not an item. An item's look is a plot3d_spec_object, built by ip3_spec from ImPlot3D's defaults, as ip_spec builds a 2-D item's.
px = cos(s) * exp(-0.12_real64 * s)                   ! a particle spiralling in as it rises
py = sin(s) * exp(-0.12_real64 * s)
pz = 0.1_real64 * s
probes = reshape([0.8_real64, 0.0_real64, 0.2_real64,  -0.3_real64, 0.5_real64, 0.5_real64, &
                  0.1_real64, -0.2_real64, 0.9_real64], [3, 3])
call ig_set_next_window(10.0_real64, 10.0_real64, 1180.0_real64, 440.0_real64)
if (ig_begin('3-D plots')) then
   w = 380.0_real64
   if (ip3_begin_plot('ip3_line, ip3_scatter, ip3_text', width=w, height=-1.0_real64)) then
      call ip3_setup_axes('x [m]', 'y [m]', 'z [m]', elevation=20.0_real64, azimuth=-50.0_real64)
      call ip3_line('particle', px, py, pz, spec=ip3_spec(line_color=RED, line_weight=2.0_real64))
      call ip3_scatter('probes', probes(1, :), probes(2, :), probes(3, :), &          ! rows: read in place
                       spec=ip3_spec(marker=ImPlot3DMarker_Diamond, marker_size=5.0_real64))
      call ip3_text('release', px(1), py(1), pz(1), offset=[0.0_real64, -14.0_real64])
      call ip3_end_plot()
   endif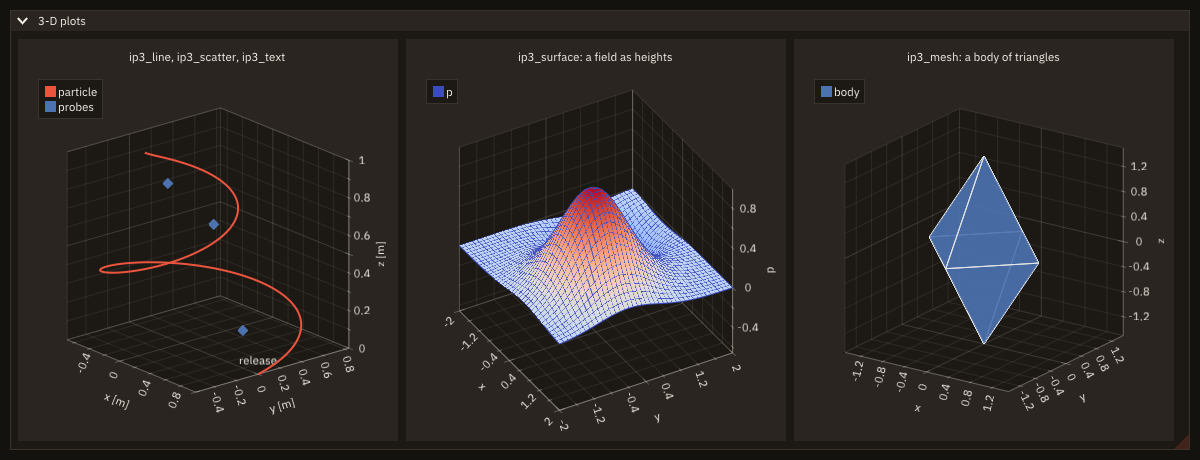
The box. x, y and z are right-handed, z up. elevation [degrees] raises the eye above the x-y plane (negative: below it); azimuth [degrees] turns the box about z, counterclockwise seen from above for a positive angle. At 0 and 0 the eye looks along +y, x to the right; at azimuth a the eye sits at -90° - a from +x toward +y, so the gallery's azimuth=-50 puts it at -40°, between +x and -y. ImPlot3D's angles turn the box; the 3-D view's azimuth is the eye's own direction, so the same number gives another view.
| Procedure | Notes |
|---|---|
ip3_begin_plot(title [, width] [, height] [, equal]) → logical | .true. when the plot is visible: declare its axes and items, then ip3_end_plot. title is the identifier ('##id' hides it). Default size: full width, ImPlot3D's default height; a negative height fills the space left. equal=.true.: one unit spans as many pixels on the three axes. |
ip3_setup_axes(xlabel, ylabel, zlabel [, auto_fit] [, limits] [, elevation] [, azimuth] [, stat]) | Labels of the three axes. Call it right after ip3_begin_plot, before any item. The axes fit the data on first use; auto_fit=.true.: every frame (a path that grows). limits = [xmin, xmax, ymin, ymax, zmin, zmax]: the initial ranges. elevation, azimuth [degrees], both or neither: the box's initial rotation, which a right double click goes back to. Ranges and rotation are set once: then they are the user's. |
ip3_line(label, x, y, z [, spec] [, colors] [, stat]) | A line through (x(i), y(i), z(i)); colors(4, size(x)): the segment from point i in colors(:, i) (RGBA in [0, 1]). |
ip3_scatter(label, x, y, z [, spec] [, colors] [, sizes] [, stat]) | A marker at each point (ImPlot3D's default marker: a circle); colors(4, size(x)): each marker filled and outlined in its own colour; sizes(size(x)): each its own radius [pixels]. |
ip3_surface(label, x, y, z [, colormap] [, scale_min] [, scale_max] [, spec] [, stat]) | A surface of heights z(i, j) over the grid x(i), y(j) (x of size(z, 1), y of size(z, 2)), or over any grid of quadrilaterals, x(i, j), y(i, j), z(i, j) of one shape. Coloured by colormap (an id from ip_colormap, default Viridis) from scale_min to scale_max (both or neither; default: the finite range of z); with spec's fill_color, one colour. |
ip3_mesh(label, x, y, z, triangles [, spec] [, stat]) | Triangles over the vertices (x(i), y(i), z(i)): triangles(1:3, k) are the vertices of the k-th, from 1 (integer(int32), 3 × n). |
ip3_text(text, x, y, z [, angle] [, offset] [, stat]) | A text centred on a point of the box, in the plot's text colour, hidden when the point is outside the box; angle [radians], offset [pixels] (x right, y down). Not an item: no legend entry, no part in fitting. |
ip3_spec([line_color] [, line_weight] [, fill_color] [, fill_alpha] [, marker] [, marker_size] [, marker_line_color] [, marker_fill_color] [, flags] [, stat]) → plot3d_spec_object | An item's style from ImPlot3D's defaults, as ip_spec for the 2-D items. marker: ImPlot3DMarker_None, _Circle, _Square, _Diamond, _Up, _Down, _Left, _Right, _Cross, _Plus, _Asterisk, _Auto. flags: ImPlot3DItemFlags_NoLegend, _NoFit; ImPlot3DLineFlags_Segments, _Loop, _SkipNaN; ImPlot3DSurfaceFlags_NoLines, _NoFill, _NoMarkers; ImPlot3DMeshFlags_NoLines, _NoFill, _NoMarkers; combine with ior. |
ip3_triangles(label, x, y, z [, spec] [, stat]) | Triangles as an item (PlotTriangle): points 1–3 are the first, 4–6 the second, ...; filled with fill_color, edged with line_color. |
ip3_quads(label, x, y, z [, spec] [, stat]) | Quadrilaterals as an item (PlotQuad): each 4 points in a row are one. |
ip3_image(label, texture, corners [, tint] [, stat]) | A texture on a quadrilateral of the box (PlotImage): corners(:, k) the x, y, z of its corners in the image's top-left, top-right, bottom-right, bottom-left order; tint (RGBA) multiplies its colours. An item: a legend entry, part of the fit. |
ip3_setup_axis(axis [, label] [, scale] [, auto_fit] [, invert] [, lock] [, no_grid] [, format] [, stat]) | One axis, 'x', 'y' or 'z' (SetupAxis, SetupAxisScale, SetupAxisFormat): scale 'linear', 'log' (values <= 0 not shown) or 'symlog'; fit every frame, inverted, locked against the mouse, without grid lines; format a C printf format of one real for its tick labels ('%.1f m'), checked as the 2-D ones (Formats). After ip3_setup_axes (which it overrides for that axis), before any item. |
ip3_setup_axis_ticks(axis, values [, labels] [, stat]) | Ticks of one axis at values instead of the automatic ones (SetupAxisTicks), labelled labels (one per value) or by the axis's format. Before any item. |
ip3_setup_box([scale] [, elevation] [, azimuth] [, animate] [, stat]) | The box's proportions, scale = [x, y, z] relative sides (SetupBoxScale; default a cube), and a view the program turns it to on this frame, elevation and azimuth [degrees] (SetupBoxRotation; animate: smoothly). A "top view" button calls it once; called every frame, the user cannot turn the box. |
ip3_setup_legend([location] [, horizontal] [, no_buttons] [, stat]) | Where the legend goes (SetupLegend): a compass point, 'n' .. 'nw' (default) or 'c'; entries in a row; entries that do not hide their items. |
ip3_mouse_ray(origin, direction [, stat]) → logical | The ray under the pointer in plot coordinates (PixelsToPlotRay): every point of the box drawn there is origin + t direction (direction of length 1); .true. over the plot. A program picks with it: where the ray meets a plane, or the point of a set nearest to the ray. Linear axes: on a log axis the ray is in the transformed space. |
ip3_plot_to_pixels(x, y, z, px, py [, stat]) | The pixel where a point is drawn now (PlotToPixels): a label beside it, a test's click. |
ip3_end_plot() | Only when ip3_begin_plot returned .true.. |
if (ip3_begin_plot('body over a field', height=-40.0_real64)) then
   call ip3_setup_axes('x', 'y', 'z', limits=[-1.0_real64, 1.0_real64, -1.0_real64, 1.0_real64, &
                       0.0_real64, 1.0_real64], elevation=30.0_real64, azimuth=-50.0_real64)
   call ip3_setup_box(scale=[1.0_real64, 1.0_real64, 0.6_real64])   ! a flatter box
   call ip3_setup_legend('ne')
   call ip3_image('field', floor, corners)                          ! the floor, z = 0
   call ip3_triangles('wedge', body(1, :), body(2, :), body(3, :))
   call ip3_quads('back', back(1, :), back(2, :), back(3, :))
   over = ip3_mouse_ray(o, d)                                       ! the ray under the pointer
   if (over .and. abs(d(3)) > 1.0e-9_real64) then
      t = -o(3) / d(3)                                              ! ... meets z = 0 there
      hit = o + t * d
   endif
   call ip3_end_plot()
endif
if (over .and. all(abs(hit(1:2)) <= 1.0_real64)) then
   write(line, '(A,F6.2,A,F6.2)') 'floor at x = ', hit(1), ', y = ', hit(2)
   call ig_text(trim(line))
else
   call ig_text_disabled('point at the floor')
endif
Colours and sizes per point, formats and ticks, the style. A set of probes coloured and sized by their readings, the x and y tick labels in metres, the height's ticks named, and the plot's background and padding changed for this plot only. ip3_push_style_color and ip3_push_style_var change ImPlot3D's style by name, as ip_push_style_color does ImPlot's, until the matching pop, ip3_pop_style_color or ip3_pop_style_var (the colour pushes of the three libraries share one stack, their variable pushes another): the colours are ImPlot3DCol_* without the prefix (PlotBg, AxisText, AxisGrid, LegendBg, ...), the variables the fields of ImPlot3DStyle (PlotPadding, LegendPadding, ViewScaleFactor, LineWeight, ...). ip3_setup_axis_ticks puts an axis's ticks at the program's values, named by its labels.
call ip3_push_style_color('PlotBg', [0.10_real64, 0.09_real64, 0.08_real64, 1.0_real64]) ! this plot only
call ip3_push_style_var('PlotPadding', [16.0_real64, 16.0_real64])
if (ip3_begin_plot('core', width=-1.0_real64, height=-1.0_real64)) then
   call ip3_setup_axes('x', 'y', 'height')
   call ip3_setup_axis('x', label='x', format='%.1f m')                ! a printf format of one real
   call ip3_setup_axis('y', label='y', format='%.1f m')
   call ip3_setup_axis_ticks('z', [0.0_real64, 0.5_real64, 1.0_real64], ['base', 'core', 'top '])
   do i = 1_int32, N                     ! cold blue to hot red; the hotter, the larger
      colors(:, i) = [(t(i) - 300.0_real64) / 90.0_real64, 0.25_real64, 1.0_real64 - (t(i) - 300.0_real64) / 90.0_real64, &
                      1.0_real64]
      sizes(i) = 2.0_real64 + 6.0_real64 * (t(i) - 300.0_real64) / 90.0_real64
   enddo
   call ip3_scatter('probes', x, y, z, spec=unlisted, colors=colors, sizes=sizes)
   call ip3_end_plot()
endif
call ip3_pop_style_var()
call ip3_pop_style_color()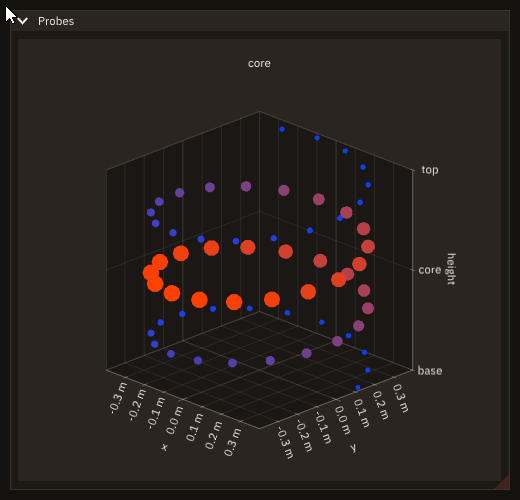
A marker drawn at the point picked on the floor would be hidden: ImPlot3D sorts each triangle by its centre, and the floor's two large triangles are nearer the eye than a point lying on them. The readout shows the point instead.
A recipe for this: Point at the floor of a 3-D plot.
- The mouse. A right drag turns the box, a left drag pans, the wheel (or a middle drag) zooms, a right double click goes back to the initial rotation, a right click opens ImPlot3D's menu; a click on a legend entry hides its item. ImPlot3D keeps the rotation and the ranges from frame to frame. A program reads nothing back: no callbacks, nothing polled but what the items draw.
- Data in place. The items take
real(real32)orreal(real64)arrays (all of one kind) of any stride, read during the call as the 2-D items' (Data in place): ImPlot3D has one byte stride for the three arrays of an item, so the rows of a3 × nmatrix,p(1, :),p(2, :),p(3, :), are read where they are, and an array of another stride is copied at it. A surface'szis read in place when its elements are equally spaced in memory (a whole array,z(:, j1:j2), a planea(k, :, :)), else copied;x(i),y(j)are expanded into the grid's two coordinate arrays (ImPlot3D reads one value per vertex: two copies, kept from item to item); a mesh's triangles are converted to ImPlot3D's 0-based indices (one copy). - Colormaps. A surface takes FIGURE's colormaps: the bundled ones, ImPlot's, the user's, their
_randlevelsvariants (ip_colormap). Each is copied into ImPlot3D's registry at its first use, and again when its colours change: a map edited byig_gradient_editrecolours the surfaces drawn with it on the same frame. - Drawing order. ImPlot3D sorts every triangle and segment by its depth, back to front, each frame: two surfaces that cross, or a long triangle beside a short one, can be drawn in the wrong order where they overlap (Known issues).
- Statuses:
FIG_ERR_ARGUMENTfor series of different sizes,xandythat do not matchz's shape,triangleswithout 3 rows or with a vertex outside[1, size(x)],limitswithout 6 values or a minimum not below its maximum, one angle without the other (ip3_setup_axes,ip3_setup_box), a surface'sscale_minwithoutscale_maxor not below it, a colormap not registered, a colour without 4 values, a NaN position of a text, a text'soffsetwithout 2 values, triangles or quads of a vertex count not a multiple of 3 or 4, an image'scornersnot 3 × 4 or its texture not initialized, a boxscalenot 3 positive values, an unknown axis, scale or legend location;FIG_ERR_STATEfor an item, a text,ip3_mouse_ray,ip3_plot_to_pixelsor a setup call outside a 3-D plot, a setup call (ip3_setup_axes,ip3_setup_axis,ip3_setup_box,ip3_setup_legend) after the first item, and any of them from a task.statis optional (absent:error stopwith the message; a usage error asapp%set_checkssays). Errors lists the messages. - Modes: the same in window, headless and remote mode: ImPlot3D draws through Dear ImGui's draw lists only. In remote mode every vertex goes to the browser each frame: a surface of 100 × 100 with its grid lines is about 65 000 vertices (measured: 39 208 for the fill, 26 328 for the lines), some 1 MB a frame before deflate (Known issues).
- Not bound yet: a depth buffer (brenocq/implot3d#151, not merged): items that intersect are drawn in sorted order, not by pixel.
Not bound yet
Custom scales and tick formatters are not wrapped: ImPlot takes them as callbacks (SetupAxisScale with a transform, SetupAxisFormat with a formatter), and FIGURE calls no Fortran from C. What they are used for is covered as data: a printf format per axis (Formats), ticks at given values with given labels (ip_setup_axis_ticks), and the fixed scales 'log', 'symlog' and 'time' (Axes).
Of ImPlot's plot and axis flags, few have an argument, and figure exports none of the ImPlotFlags_* and ImPlotAxisFlags_* constants, since no call takes them. ip_begin_plot takes equal (ImPlotFlags_Equal), and a title that starts with ## is hidden (ImPlotFlags_NoTitle); ip_setup_axis takes auto_fit, opposite, invert, lock and no_grid (ImPlotAxisFlags_AutoFit, _Opposite, _Invert, _Lock, _NoGridLines), and an axis without label has none (_NoLabel). The other flags, and what comes closest:
| Flag | What comes closest |
|---|---|
ImPlotFlags_NoLegend | each item without an entry: ip_spec(flags=ImPlotItemFlags_NoLegend), or a label that starts with ## (Items) |
ImPlotFlags_NoBoxSelect | ip_cancel_selection on the frame ip_plot_selection is .true.: the box ends and the release zooms nothing (Reading a plot) |
ImPlotFlags_Crosshairs | ip_plot_mouse while ip_plot_hovered, and ip_inf_lines at the pointer, as cb_plot_readout does (Reading a plot) |
ImPlotFlags_NoInputs | ip_setup_axis(..., lock=.true.) on every axis: no pan, no zoom, the box spans the locked axes; a click on the legend still hides an item, unless ip_hide_next_item(..., always=.true.) |
ImPlotFlags_NoMenus, _NoMouseText, _NoFrame, _CanvasOnly | none |
ImPlotAxisFlags_NoTickLabels | fixed ticks with blank labels: ip_setup_axis_ticks(axis, values, labels) |
ImPlotAxisFlags_NoTickMarks | none alone; ip_setup_axis_ticks with no values ([real(real64) ::]) leaves the axis without ticks, labels and grid lines |
ImPlotAxisFlags_NoInitialFit | ip_setup_axis_limits or ip_setup_axes_limits: the first range given instead of fitted |
ImPlotAxisFlags_LockMin, _LockMax | ip_setup_axis_constraints: bounds the range cannot pass, not a fixed end |
ImPlotAxisFlags_NoMenus, _NoSideSwitch, _NoHighlight, _Foreground, _RangeFit, _PanStretch, _TickLabelsInside | none |