4. From the log, with a script
A real solver writes its history to a log, one line per iteration. Here is the pretend one, writing run.dat (with a restart at iteration 60) and run.csv:
solver.f90
fortran
program solver
!< A pretend flow solver: the logs every chapter of the tutorial reads.
!<
!< run.dat: iteration, three residuals, drag coefficient and its error, whitespace separated, a restart (blank line)
!< at iteration 60; run.csv: the same history as CSV with a header row.
use, intrinsic :: iso_fortran_env, only : real64
implicit none
integer, parameter :: rk = real64
integer            :: dat, csv, it
real(rk)           :: t, rho, mom, energy, cd, dcd

open(newunit=dat, file='run.dat', status='replace', action='write')
open(newunit=csv, file='run.csv', status='replace', action='write')
write(dat, '(A)') '# iteration  continuity  momentum  energy  cd  dcd'
write(csv, '(A)') 'iteration,continuity,momentum,energy,cd,dcd'
do it = 1, 120
   t = real(it, rk)
   rho = 10.0_rk**(-0.045_rk * t) * (1.0_rk + 0.35_rk * sin(t / 3.0_rk))
   mom = 10.0_rk**(-0.040_rk * t - 0.4_rk) * (1.0_rk + 0.25_rk * cos(t / 4.0_rk))
   energy = 10.0_rk**(-0.050_rk * t + 0.3_rk)
   cd = 0.30_rk + 0.25_rk * exp(-t / 25.0_rk) * cos(t / 6.0_rk)
   dcd = 0.04_rk / sqrt(t)
   if (it == 61) write(dat, '(A)') ''
   write(dat, '(I0,5(1X,ES12.5E2))') it, rho, mom, energy, cd, dcd
   write(csv, '(I0,5(",",ES12.5E2))') it, rho, mom, energy, cd, dcd
enddo
close(dat)
close(csv)
endprogram solver
text
$ head -n 4 run.dat
# iteration  continuity  momentum  energy  cd  dcd
1  1.00482E+00  4.51026E-01  1.77828E+00  5.36869E-01  4.00000E-02
2  9.88751E-01  4.03780E-01  1.58489E+00  5.18076E-01  2.82843E-02
3  9.48652E-01  3.57237E-01  1.41254E+00  4.94586E-01  2.30940E-02
A gnuplot script plots it, through the foresight command line:
gnuplot
# Tutorial 4: the solver log, plotted by a script.
set terminal html size 640,380
set output 'ch4.html'
set title 'Residual history'
set xlabel 'iteration'; set ylabel 'residual'
set logscale y
set grid
plot 'run.dat' using 1:2 with lines title 'continuity', \
     ''        using 1:3 with lines title 'momentum', \
     ''        using 1:4 every 8 with linespoints pt 7 title 'energy'
text
$ foresight residuals.gp
foresight: ch4.htmlusing 1:2plots column 2 against column 1;using 2alone plots it against the point number, asusing 0:2.''repeats the previous file; abbreviations work as in gnuplot:u 1:3 w l t 'momentum'.every 8keeps one point in 8, in each block.- The blank line of the restart ends a block: the lines break there, as in gnuplot. Two blank lines would start a new dataset, selected with
index.
Without a script
-e runs commands before the script — or instead of it:
text
$ foresight -e "set logscale y" -e "plot 'run.dat' u 1:2 t 'continuity'" -o ch4-e.svg
foresight: ch4-e.svg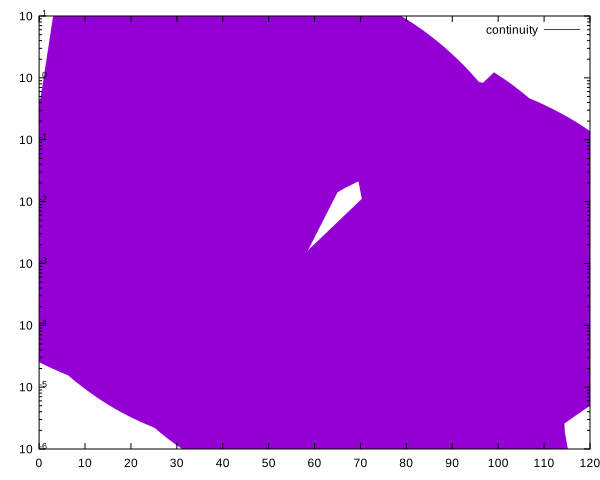
The output defaults to the script name, residuals.html; -o sets another, and the extension picks the format.
What you learned
Scripts, data files and the command line; using, every, ''. Reference: Command Line, Data Files, gnuplot Subset.
Next: 5. CSV and expressions.