1. A first plot
The solver holds its residual history in an array: plot it, from the program itself.
program ch1_first_plot
!< Tutorial 1: the residual of a run, plotted from the arrays that hold it.
use foresight, only : figure_object, I4P, R8P
implicit none
type(figure_object)    :: fig      ! the figure: one plot, gnuplot defaults
real(R8P), allocatable :: it(:)    ! iterations
real(R8P), allocatable :: res(:)   ! continuity residual
integer(I4P)           :: i

it = [(real(i, R8P), i = 1, 120)]
res = 10.0_R8P**(-0.045_R8P * it) * (1.0_R8P + 0.35_R8P * sin(it / 3.0_R8P))

call fig%init(width=640_I4P, height=380_I4P)
call fig%set_title('Residual history')
call fig%set_xlabel('iteration')
call fig%set_ylabel('continuity residual')
call fig%plot(it, res, title='continuity')
call fig%save('ch1.html')   ! interactive page
call fig%save('ch1.svg')    ! static image, the same drawing
endprogram ch1_first_plotfigure_objectis a figure: one plot, with gnuplot's defaults (600x480 px, autoscaled axes, the key top right).initresets it, here with a size.set_title,set_xlabel,set_ylabelare gnuplot'sset title,set xlabel,set ylabel.plot(x, y, title=...)adds a series;titleis its entry in the key. Call it again to add more.saverenders the figure; the format follows the extension:.htmlan interactive page,.svga static image of the same drawing,.txt(or-, the standard output) text.
Building it
fobis build --mode foresight-static-gnu       # lib/libforesight.a and its modules
gfortran -I lib/mod ch1_first_plot.f90 lib/libforesight.a -o ch1_first_plot
./ch1_first_plot                              # writes ch1.html and ch1.svg
use foresight gives the whole API and the PENF kinds I4P, R8P. As a FoBiS dependency, see Installation.
The page
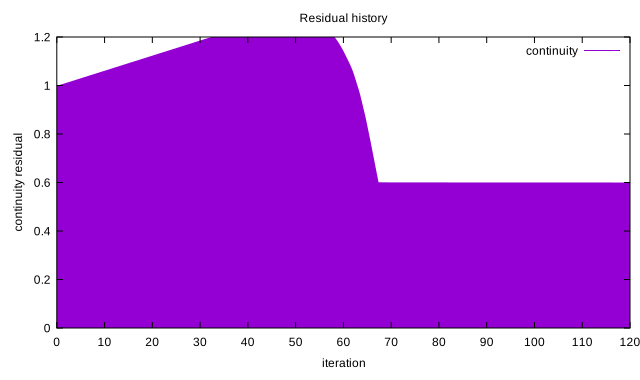
Open ch1.html: it needs nothing but a browser, also from a file on a cluster copied to your laptop. The plot above is that page: wheel to zoom about the pointer (shift: x only, ctrl: y only), drag to pan, right-drag a box, u to undo, a to autoscale, g for the grid, h for help. Ticks and labels are regenerated at every zoom, by the same rules as the Fortran side.
The static image is the same drawing, for reports and slides:
What you learned
A figure, a series, labels, and two output formats from one save call each. Reference: Fortran Library, Output Formats, Interactive Viewer.
Next: 2. Styles and the key.