gnuplot Subset
foresight interprets a subset of the gnuplot command language. Everything outside it is an error naming the command and its line (script.gp:12: unsupported command "splot"), never silently ignored: a script that runs is a script that did what it says.
Syntax
- One statement per line, or several separated by
; #starts a comment (outside quotes)- A line ending with
\continues on the next one - Strings in single quotes are literal; in double quotes
\tis a tab and\takes the next character literally (\",\\) - Keywords accept gnuplot abbreviations: the shortest accepted form is in bold below
Commands
| Command | Effect |
|---|---|
| plot items | replace the current plot and render it to the output |
| replot [items] | render the last plot again (re-reading its data), optionally adding items |
| set option | set an option |
| unset option | reset an option |
set / unset options
| Option | set | unset |
|---|---|---|
title "text" | panel title | no title |
xlabel / ylabel / y2label "text" | axis label (y2 on the right) | no label |
xrange / yrange / y2range [min:max] | axis range; * or empty autoscales an end; min > max reverses | autoscale |
logscale [axes] [10] | base-10 log axes; axes concatenates x, y, y2 (y, xy2), all when absent | linear axes |
grid [polar [STEP]|spiderplot] | grid at major ticks; polar: on a polar panel, rings at the r ticks and spokes every STEP (30 degrees by default, in the angle unit) instead | no grid |
| polar | polar coordinates: items are theta:r, functions of t | x:y coordinates |
angles degrees|radians | unit of theta, of t and of the trigonometric functions (radians by default) | — |
theta [right|top|left|bottom] [clockwise|cw|counterclockwise|ccw] | where theta = 0 lies and its direction (right, counterclockwise by default) | right, counterclockwise |
rrange / trange [min:max] | r range (min at the pole, 0 when autoscaled) and theta range of the functions (a full turn by default) | — |
rtics [auto | STEP | START,STEP[,END]] | ticks of the r axis (automatic by default) | no r ticks |
ttics [[START,]STEP] [format "fmt"] | theta labels around the polar plot, in degrees; every 45 degrees without STEP (gnuplot: none) | no theta labels (the default) |
| raxis | the r axis, from the pole towards the right of the page (the default) | no r axis |
border [MASK] [polar] | frame sides, 1 bottom, 2 left, 4 top, 8 right (31, all, by default); polar adds the circle of the largest r, keeping the sides when no MASK is given | no border |
key [on|off] [left|right|center] [top|bottom|center] [box|nobox] [autotitle [columnhead]|noautotitle] | show the key, inside the plot area (top right by default), see below; untitled items: as written, by column header, or none | hide the key |
xtics / ytics / y2tics [auto | STEP | START,STEP[,END]] [mirror|nomirror] | tick positions, see below; y2tics is off by default, see below | no ticks, labels nor grid lines |
format [axes] ["format"] | tick label format of the axes (as logscale), see below | default labels |
datafile separator [whitespace|tab|comma|"chars"] | cell separators of data files, see Data Files; no argument: whitespace | whitespace (unset datafile) |
samples N[,M] | points of each function, 100 by default; M is accepted and ignored | — |
style data STYLE | style of data items without with | — |
style function STYLE | style of functions without with: lines, points, linespoints | back to lines |
style line N [lc ...] [lt N] [lw W] [dt N] [pt N] [ps S] | line style N, used by ls N | — |
style fill empty|[transparent] solid [D]|[transparent] pattern [N] [border [lc C|-1]|noborder] [segments N] | fill of the boxes and filled curves plotted next; empty with border by default; pattern N one of the 8 patterns of gnuplot's svg terminal, cycling over the filled items from N; segments N a foresight extension, see below | — |
paxis N range [min:max]|tics [...]|label "text" | parallel axis N of the parallel axis and spider plots: its range (autoscaled to its values, not extended), ticks (off by default), label | unset paxis N tics: no ticks |
| spiderplot | spider plot coordinates and data style | back to lines |
style spiderplot [fs FILL] [lw W] [pt N] [ps S] | polygons of the spider plots (empty with border by default) | — |
rgbmax V | full intensity of the components of RGB images (255 by default) | 255 |
palette [rgbformulae R,G,B|defined (v c, ...)|gray|color|viridis] [positive|negative] [maxcolors N] | palette of the images; none: the default (rgbformulae 7,5,15) | — |
cbrange [min:max] | value range of the palette; * or empty autoscales an end | — |
cblabel "text" | color box label | no label |
| colorbox | color box of the images, at the right of the plot (the default) | no color box |
boxwidth [W] [absolute|relative] | box width; no W: boxes touching (the default) | boxes touching |
style boxplot [range R|fraction F] [outliers|nooutliers] [pointtype P] [candlesticks|financebars] [medianlinewidth W] [separation S] [labels off|auto|x] [sorted|unsorted] | layout of the boxplots plotted next | — |
style histogram clustered [gap G]|rowstacked | layout of the histograms plotted next; clustered, gap 2 by default | — |
readout [on|off] [left|right|center] [top|bottom|center] [horizontal|vertical] [opaque|noopaque] [size H] | foresight extension: where and how the readouts of the panel are drawn | readouts not drawn |
output "file" | output file: .svg, .html, .txt, - | — |
terminal svg|html [size W,H] [refresh S] [theme classic|vfd|lcd] [glow|noglow] | output format, size in px, HTML reload period; the theme (foresight extension, any terminal) | — |
terminal dumb [size COLS,ROWS] [mono|ansi|ansi256|ansirgb] | text output, 79 x 24 by default, on the standard output; the series in ANSI colors, see Output Formats | — |
terminal block [half|quadrants|sextants|braille] [size COLS,ROWS] [mono|ansi|ansi256|ansirgb] | text output drawn with Unicode block or Braille characters, 2 x 2 dots per character by default (quadrants), see Output Formats | — |
multiplot [layout R,C] [title "text"] | grid of panels, or panels in their origin/size boxes without layout, see below | back to one panel |
origin [X,Y] | bottom left corner of the plot, page fractions (default 0,0); not with a layout | — |
size [square|nosquare|ratio R|noratio] [W,H] | plot size, page fractions (default 1,1; not with a layout); square, ratio R (> 0): the plot area height over width | — |
plot items
plot 'file' [using SPEC] [index N] [every N] [smooth FILTER] [with STYLE] [title "text" | notitle]
            [axes x1y1|x1y2] [lc [rgb] "color" | lc N] [lw W] [dt N] [ps S], ...
plot FUNCTION [with STYLE] [title "text" | notitle] [axes x1y1|x1y2] [lc ...] [lw W] [dt N] [ps S], ...| Modifier | Meaning |
|---|---|
'file' | data file; '' repeats the previous one |
| function | an expression of x, see below |
using SPEC | fields separated by :, each a column number (0 is the point number), a quoted column header or a parenthesized expression: Y, X:Y, or the error bar layouts below; a last field xtic(N) (xticlabels(N)) labels the points with the text of column N, see Histograms |
index N | dataset N (0-based) of the file |
| matrix | the file is a matrix of values (columns the x index, rows the y index, from 0), for with image |
every I:J:K:L:M:N | gnuplot's point_incr:block_incr:start_point:start_block:end_point:end_block, empty fields default: every 2, every ::1::10, every :::1::1 |
smooth FILTER | unique, frequency, fnormal, cumulative, cnormal, see below |
with STYLE | lines (l), points (p), linespoints (lp), impulses (i), steps (st), fsteps (fs), histeps (his), dots (d), see below; yerrorbars (yerr), xerrorbars (xerr), xyerrorbars (xyerr), yerrorlines (yerrorl), xerrorlines (xerrorl), xyerrorlines (xyerrorl), boxes, boxerrorbars (boxer), boxxyerror (boxx), candlesticks (can) [whiskerbars [F]], financebars (fin), boxplot, see below; vectors (vec), arrows, ellipses (ell), polygons (poly), labels, sectors (sec), see below; parallelaxes (parallel) [at X], spiderplot (spider), see below; filledcurves (filledc) [closed|x1|x2|y=V|xy=X,Y] [above|below], see below; histograms (hist), see below; image (ima), rgbimage, rgbalpha (rgba), see below; circles (cir), foresight's pie [donut F], see below; foresight's gauge range [A:B] [segments N], radar, rose [linear], see below; foresight's readout, see below |
fs / fillstyle FILL | fill of a box or filled curve item, words as set style fill |
format "fmt" | foresight extension, readouts and gauges: the glass of the readout, %10.3e by default |
title "text" / notitle | key entry; by default the item as written, as gnuplot: 'run.dat' u 1:($2*1e3), sin(x)/x |
title columnhead[(N)] | key entry from the column header of column N, or of the y column |
axes x1y1 / x1y2 | plot against the first (default) or the second y axis |
lc [rgb] "color" / lc N / lt N | color, or the N-th palette color |
lw W, dt N, ps S | line width [px], dash type 1..5, point size |
pt N / pointtype N | point type; without it, points are round dots |
ls N | line style N of set style line; the options after it override it |
using defaults as gnuplot: 1:2, or 0:1 for single-column files; 1:2:3 for yerrorbars and xerrorbars, 1:2:3:4 for xyerrorbars (the same for the errorlines). Error bar layouts:
| Style | Columns |
|---|---|
yerrorbars | x:y:dy or x:y:ylow:yhigh |
xerrorbars | x:y:dx or x:y:xlow:xhigh |
xyerrorbars | x:y:dx:dy or x:y:xlow:xhigh:ylow:yhigh |
boxes | x:y or x:y:width |
filledcurves | x:y (to y=V, or the closed polygon), x:y1:y2 (a band) |
histograms | y, the rows at the point numbers 0, 1, ... |
image | x:y:z on a regular grid (default 1:2:3), or a matrix file |
circles | x:y (default radius), x:y:radius, x:y:radius:start:end (wedges, degrees) |
pie | y, one slice per row; y:xtic(N) names the slices |
gauge | y (the last finite value), or x:y |
radar, rose | y, one spoke or sector per row; y:xtic(N) names them |
Expressions in using
A field in parentheses is an expression evaluated on each row, with gnuplot's semantics:
plot 'run.dat' using ($1/3600):($2*1e3)             # hours, milli-units
plot 'run.dat' using 1:($3 > 0 ? log10($3) : 1/0)   # 1/0 drops a point: a gap
plot 'run.dat' using 0:(sqrt($2**2 + $3**2)) with lines| Columns | $N or column(N), $0 is the point number; column() takes an expression: column($1 + 1), or a header name: column("residual") |
| Operators, loosest first | ?: · || · && · == != · < <= > >= · + - · * / % · unary - + ! · ** |
| Functions | abs acos asin atan atan2 ceil cos cosh exp floor int log log10 sgn sin sinh sqrt tan tanh |
| Constants | numbers (2, 1.5, .5, 1e-3), pi |
The rules are gnuplot's, checked against gnuplot 6.0:
**is right associative and binds tighter than a unary minus:-2**2is -4,2**3**2is 512.- Integer constants stay integers:
1/2is 0 and-5/2is -2, but1/2.is 0.5; an integer overflow gives a real. Columns are reals, so$2/2is a real division.floor,ceil,int,sgn, comparisons and logical operators give integers. &&,||and?:evaluate only the operand they need:$2 > 0 && log($2) > 1never takes the log of a negative.- A missing cell, a division by zero, a domain error (
sqrt(-1),log(0)) or an overflow make the point undefined: a gap in the line, as gnuplot's1/0.
A field must be a column number or one parenthesized expression, as in gnuplot: using 1:$2 and using 1:2*3 are errors. Syntax errors point at the character: using: unexpected ")" at character 6 of "($2 +)".
Beyond gnuplot, foresight accepts % and the logical operators on reals, and an overflow gives a gap where gnuplot stops the plot. Not supported: user variables and functions, string values (stringcolumn, string operators), bitwise operators, the pseudo-columns -1 and -2.
Functions
A plot item that is not a quoted file is a function of x, with the operators, functions and rules of using expressions, without columns:
plot 'run.dat' u 1:2, 1e-1 * exp(-x/5) t 'model'
plot sin(x)/x, x > 0 ? log(x) : 1/0
set samples 400; plot x * sin(1/x)
As gnuplot, a function is sampled at set samples points (100) evenly over the x range before its extension to the ticks: the xrange ends where set, else the extent of the data of the whole plot, else [-10:10]. On a log x axis the samples are evenly spaced in log x. Undefined values (1/0, log(-1)) are gaps. Functions are drawn with lines by default whatever set style data says; set style function points (or linespoints) changes it, error bars are not usable. The expression runs up to the first item option, so blanks may separate its terms: plot x * 2 + 1 t 'line'.
In the HTML page a zoom does not resample: the samples are those of the original range.
On a polar panel a function is r of t, sampled over trange (a full turn by default) as gnuplot: plot 1 + cos(t).
Smoothing
smooth FILTER replaces the points of a data item by a filtered series, as gnuplot computes it. Each run of points (a block of the file, ended also by an undefined point or by a value not placeable on a log axis) is sorted by x, and its points of equal x are merged into one:
| Filter | y of the merged point |
|---|---|
unique | the mean of their y |
frequency | the sum of their y: with using (BIN):(1), a histogram |
fnormal | frequency divided by the sum of y over the whole item |
cumulative | the sum of y up to that x, within the run |
cnormal | cumulative divided by the sum of y over the whole item: an empirical distribution |
plot 'run.dat' u 1:2 smooth unique                              # iterations repeated by a restart: averaged
plot 'run.dat' u (floor($5/0.02)*0.02):(1) smooth frequency     # histogram of column 5, bins 0.02 wide
plot 'run.dat' u 5:(1) smooth cnormal                           # its empirical distribution
The cookbook draws the last two.
The runs stay separate lines. smooth applies to lines, points and linespoints; with error bars or on a function it is an error (gnuplot ignores the extra columns, or the filter). The other filters (splines, Bézier, kdensity, ...) are not supported.
Second y axis
set logscale y
set ytics nomirror; set y2tics
set ylabel 'residual'; set y2label 'coefficient'
plot 'run.dat' u 1:2 t 'residual', '' u 1:3 axes x1y2 t 'cd'
The items plotted axes x1y2 are scaled on the second y axis, autoscaled on them alone (on the points inside the x range), with its own y2range, logscale y2 and format y2. As in gnuplot, the y2 ticks and labels are off until set y2tics: they go on the right border, not mirrored on the left (set y2tics mirror does). The y ticks stay mirrored on the right unless set ytics nomirror. The axis is drawn only when it has data, or a range fixed at both ends; y2label reads upward on the right, as ylabel on the left. In the HTML page the y2 ticks follow the zoom and the readout shows the y2 value too.
Column headers
set datafile separator comma
plot 'run.csv' using 1:"residual" title columnhead, '' using "iteration":(column("cd")*1e3)
set key autotitle columnhead       # every untitled item takes the header of its y column
As in gnuplot, the first row of each dataset is a header as soon as an item uses it: a quoted name in using (also in column("name")), title columnhead, or set key autotitle columnhead. It is then neither a point nor counted by $0; otherwise it is an ordinary row, whose words are missing values. A name is looked up in the header of the dataset each row belongs to; a name no selected dataset has is an error. title columnhead takes the header of the first column the y field reads (($3*2) gives the header of column 3), columnhead(N) of column N; no header, no title. Quoted header cells may hold blanks: "the res". set key noautotitle leaves untitled items, functions included, out of the key.
Ticks and label formats
set xtics 0.5            # a tick every 0.5
set xtics 0,5,30         # from 0 to 30 every 5
set ytics 10             # on a log axis the step is a factor: 1, 10, 100, ...
unset xtics              # no ticks, no labels, no grid lines
set format y "%.1e"      # 1.0e-03
set format x "%g s"      # 0.5 s
set format y "%h"        # like %g, the exponent as a superscript: 1x10⁻⁵
As in gnuplot, set xtics without positions (alone, or with only mirror/nomirror) keeps the last ones and turns the ticks back on after unset xtics; set xtics auto returns to automatic ticks.
As in gnuplot, an autoscaled end extends outward to a multiple of the step, unless it lies below START or beyond END; after unset xtics it does not extend at all. Log axes always extend to whole decades.
The formats are C printf's for one number: %[flags][width][.precision] with the conversions f, e, E, g, G and gnuplot's h, flags -, +, space, 0, and %% for %. The value formatted is the exact decimal of the tick, so set xtics 0.1 never shows 0.30000000000000004, and a rounding tie goes to the even digit, as printf does (0.125 with %.2f is 0.12).
Both settings follow the zoom in the HTML page: the viewer places and formats the ticks by the same rules.
Key
set key bottom left box
set key center           # centred both ways
set key top center       # top, centred horizontally
set key outside          # right of the plot, top aligned
set key outside left bottom
set key below            # a row below the plot (above: over it), wrapping when the panel is narrow
set key inside           # back inside, keeping the rows
Position words apply in order; center centres the direction not named yet, as in gnuplot. Titles are right-aligned with their sample on the right. Inside, the key lies in the plot area. outside puts it in the left or right margin, aligned with the top, centre or bottom of the plot; centred horizontally, above (top) or below (bottom) the plot; centred both ways it stays inside, as gnuplot. below and above centre a row of entries under the x label or between the title and the plot (below left aligns it to the left); horizontal and vertical choose rows or a column anywhere. The plot shrinks to make room for a key outside it.
Styles
set style data linespoints
set style line 1 lc rgb '#e51e10' lw 2 dt 2
plot 'run.dat' u 1:2 ls 1 t 'residual', '' u 1:3 lt 3 t 'momentum'
ls N of an undefined style uses the palette color N, as gnuplot's linetype.
Lines, steps and impulses
plot 'run.dat' u 1:2 w steps, '' u 1:2 w histeps, '' u 1:3:4 w yerrorlinesstepsjoins the points horizontally then vertically,fstepsvertically then horizontally;histepsdraws a step around each point, its edges halfway to the neighbours (the end steps symmetric), from and back to y = 0 at the ends; unlike gnuplot the outer edges and 0 are in the autoscale, as for boxes;impulsesdraws a segment from y = 0 to each point, 0 included in the y autoscale (as gnuplot);dotsdraws a tiny dot per point (point type 0);yerrorlines,xerrorlines,xyerrorlinesarelinespointswith the error bars of the matchingerrorbarsstyle, with the sameusinglayouts.
Functions can be drawn with all of these but the error styles. As gnuplot, his abbreviates histeps; histograms needs at least hist.
Box, finance and boxplot styles
set style fill solid 0.3
plot 'bench.dat' u 1:2:3 w boxerrorbars, '' u 1:4:5:6:7 w candlesticks whiskerbars 0.5
plot 'timings.dat' u (1):2:(0.5):1 w boxplot| Style | using | Drawing |
|---|---|---|
boxerrorbars | x:y:ydelta, x:y:ydelta:width, x:y:ylow:yhigh:width | a box from 0 (as boxes, a width <= 0 meaning boxwidth) with a y error bar |
boxxyerror | x:y:xdelta:ydelta, x:y:xlow:xhigh:ylow:yhigh | a rectangle in the fill style |
candlesticks | x:open:low:high:close[:width] (or x:box_min:whisker_min:whisker_max:box_max) | a box between open and close, whiskers to low and high; with an empty fill a box whose close is below its open is filled; whiskerbars [F] adds crossbars F box widths long |
financebars | x:open:low:high:close | a line from low to high, a tick on the left at the open, on the right at the close |
boxplot | x:y[:width[:factor]] | the quartiles of the y values as a box with the median line, whiskers to the farthest values within 1.5 interquartile ranges, the others as outliers (point type 7) |
As gnuplot, the candlestick width is set boxwidth or the 6th column, else a few pixels; financebars ticks are a few pixels long. A boxplot summarizes all the values of its item at the x of the first row; a 4th using field, a column number, names the level of each value (its text): one box per level, separation apart (1), named on the x axis in order of appearance (sorted: alphabetical). The quartiles are gnuplot's: the value of rank n/4 (the mean of ranks n/4 and n/4 + 1 when n/4 is whole); a level of fewer than 4 values draws nothing. set style boxplot fraction 0.95 has the whiskers span 95% of the values instead, nooutliers drops (and leaves out of the autoscale) the outliers, financebars draws the boxplots as finance bars. The box width is the 3rd field, else boxwidth, else 0.5; the x autoscale reaches a box width beyond the boxes, as gnuplot. Boxplots are computed when plotted: a watched script recomputes them on each change of its data.
Vectors, ellipses, polygons, labels and sectors
plot 'flow.dat' u 1:2:3:4 w vectors filled head, '' u 1:2:5 w labels left offset 1,0 point pt 7
plot 'shapes.dat' u 1:2:3:4:5 w ellipses, 'blocks.dat' w polygons fs solid 0.3
set polar; set angles degrees; plot 'wind.dat' u 1:(0):(40):2 w sectors| Style | using | Drawing |
|---|---|---|
vectors | x:y:xdelta:ydelta | an arrow from x:y to x+xdelta:y+ydelta; head (default), heads, nohead, backhead, filled, empty after the style |
arrows | x:y:length:angle | an arrow of length (> 0: x units, the same on the page at any angle [deg]; in (-1, 0): a fraction of the plot width) |
ellipses | x:y, x:y:diameter, x:y:major:minor[:angle] | an ellipse in the fill style, the major diameter in x units and the minor one in y units, rotated on the page (gnuplot units xy); without diameters (or a negative one) 5% x 3% of the plot |
polygons | x:y | a closed polygon per block of the data (blocks end at single blank lines), in the fill style |
labels | x:y:column | the text of the column at each point; left, center, right, rotate by A, offset X,Y (characters), point (with pt, ps), tc "color" anywhere in the item |
sectors | azimuth:radius:angle:width[:x0:y0] | the annular sector from the azimuth over angle, from radius over width, about x0:y0 (0:0), angles in the set angles unit oriented by set theta; on a polar panel azimuth:radius are theta:r |
Arrowheads are gnuplot's (18 px, 15 degrees) and, as label texts, keep their pixel size: in the HTML page a zoom moves them with the data. Labels are black (the frame color of a theme) unless tc is given, as gnuplot. Unlike gnuplot, sectors widen the autoscale to their whole extent. Not supported: arrowstyle, variable colors and rotations, units xx|yy, label fonts and hypertext.
Parallel axes and spider plots
plot 'scores.dat' u 2 w parallelaxes t 'speed', '' u 3 w parallelaxes t 'memory', '' u 4 w parallelaxes t 'cost'

set spiderplot
set style spiderplot fs transparent solid 0.2 border
set paxis 1 range [0:100]; set paxis 1 tics; set grid spiderplot
plot 'scores.dat' u 2:key(1) t 'speed', '' u 3 t 'memory', '' u 4 t 'cost'
As gnuplot, each item is an axis (a column of the data) and each row a line across the axes (parallelaxes) or a polygon (spiderplot); both are alone in their panel.
- Every axis has its own scale,
set paxis N range [min:max], autoscaled to its values without extension (the smallest at the bottom or at the centre); its ticks are off untilset paxis N tics(theset xticsforms). parallelaxes: the axes at x = 1, 2, ... (orat X), the x range one unit beyond them, titled below by their items; the rows in the first item's style. Unlike gnuplot, no y axis is drawn: its numbers would belong to no axis.spiderplot(afterset spiderplot, orwith spiderplot): the axes from the centre, the first up, the others clockwise, labelled by their item titles (elseset paxis N label); a polygon per row in its palette color and theset style spiderplotfill, named in the key byusing ...:key(N)(the text of column N);set grid spiderplotdraws the web at the ticks of the first axis.
foresight's own with radar is the transposed shorthand: an item per polygon, a spoke per row, a common scale. Not supported: newspiderplot, set style parallelaxis, lc variable, keyentry.
Point types
plot 'run.dat' u 1:2 w lp pt 7 t 'residual', '' u 1:3 w p pt 4 ps 1.5 t 'cd'The shapes are those of gnuplot's svg terminal: pt 0 a dot, 1 plus, 2 cross, 3 star, 4 square, 6 circle, 8 triangle, 10 inverted triangle, 12 diamond, 14 pentagon, each odd type from 5 the filled shape before it; beyond 15 they cycle. A marker is 9 px wide at ps 1, its lines lw wide. Without pt a point is foresight's round dot, 6 px at ps 1. In the HTML page markers keep their shape and size under zoom; the text terminal draws every point with the symbol of its color.
Multiplot
set multiplot layout 1,2 title 'Monitor'
set title 'residual'; set logscale y
plot 'run.dat' u 1:2 w l t 'res'
set title 'drag'; unset logscale y
plot 'run.dat' u 1:3:4 w yerrorbars t 'cd'
unset multiplot
Each plot fills the next panel with the settings in force. The advance happens at the first set, unset or plot after a plot, so settings written for the next panel never alter the one just plotted. A plot beyond the last panel is an error.
Without layout, each panel lies in the box of its set origin and set size, fractions of the page below the multiplot title, from the bottom left as gnuplot. Panels may overlap: an inset.
set multiplot title 'Run monitor'
plot 'run.dat' u 1:3 w l t 'cd'
set origin 0.35,0.35; set size 0.55,0.5; unset key; set logscale y
plot 'run.dat' u 1:2 w lp
unset multiplot
Panels are drawn in order, without a background: in the HTML page the mouse acts on the topmost panel under it. On the standard output (set terminal dumb or block), a multiplot is printed once, complete, at unset multiplot; files are rewritten at each plot, so that a watched page shows the panels done so far.
Boxes and filled curves
set style fill solid 0.5
set boxwidth 0.8 relative
plot 'run.dat' every 10 u 1:5 w boxes t 'cd every 10 iterations'
A box stands on y = 0, down for a negative value. By default the boxes touch: each edge lies halfway to the next point, the end boxes symmetric. set boxwidth W gives them the width W, set boxwidth F relative the fraction F of the default, a third using column each its own width. The fill is the item color: empty draws the border only, solid D fills at opacity D (transparent changes nothing in SVG, as in gnuplot's svg terminal); border lc C colors the border, noborder drops it.
plot 'run.dat' u 1:($5-$6):($5+$6) w filledcurves fs transparent solid 0.3 t 'cd +/- dcd', \
     ''        u 1:5 w l t 'cd'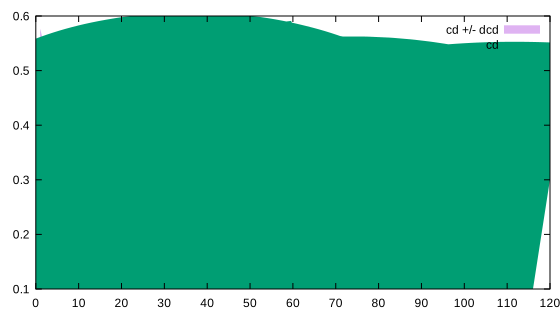
filledcurves fills the band between two columns (x:y1:y2), the area down to the line y=V (y1=V), to the bottom (x1) or top (x2) of the plot, to the point xy=X,Y, or the polygon of the points (closed, the default with two columns); above and below keep the parts where the curve is above or below its line, or where the first curve of a band is above or below the second. As gnuplot, it fills even with an empty fill style and draws no border: plot the curve too for an outline. Undefined points split the fill as they split a line.
fs pattern N fills with one of the 8 patterns of gnuplot's svg terminal: 0 empty, 1 and 2 crosshatches, 3 solid, 4 to 7 hatches (down, up, steeper up, steeper down), N cycling every 8; set style fill pattern N gives the filled items of a plot the patterns N, N + 1, ... as gnuplot. In text a pattern is a fill character (x, X, \, /), in block its hatches are dots.
Two deliberate differences from gnuplot, so that a bar is never misread:
- The y autoscale of boxes reaches 0 (and that of
filledcurves y=Vreaches V). gnuplot autoscales to the values only and draws the bars from the bottom of the plot: with values 3, 5, 2 it draws the 3 a third as long as the 5. - The x autoscale reaches the box edges whatever the width. With touching boxes gnuplot leaves them out and cuts the first and last bar in half.
In text a fill is drawn with the symbol of its series (block: whole dots), whatever its opacity.
Histograms
set style fill solid 0.6 border -1
plot 'timings.dat' u 2:xtic(1) w histograms t 'mesh', '' u 3 w hist t 'fluxes', '' u 4 w hist t 'comm'
Each histograms item gives one bar per row of its file, the rows at 0, 1, 2, ...; the items of a panel are laid out together, as gnuplot:
set style histogram clustered gap G(the default, gap 2): the k items of a row side by side, each bar 1/(k + G) wide, the cluster centred on its row;set style histogram rowstacked: one stack per row, 1 wide; positive values pile up from 0, negative ones down from 0, each sign on its own stack.
set boxwidth F scales every bar. The x autoscale goes one unit beyond the first and last rows, as gnuplot; the y one reaches 0 for clustered bars too (gnuplot leaves it out, as for boxes). The fill is set style fill or the item's fs.
using Y:xtic(N) labels each row with the text of column N (quoted, it may hold blanks): when any item has labels, they replace the x ticks, at their rows, as gnuplot; the HTML page keeps them through a zoom. xtic works with any style, using 0:2:xtic(1) w boxes too.
Readouts
A foresight extension, not gnuplot (gnuplot rejects these scripts): with readout shows the last finite value of an item in seven-segment digits, as the digital instrument clusters of 1980s cars. It is made for live monitoring with --watch and for showcase pages, not for publication figures.
set multiplot title 'Run monitor'
set origin 0,0.68; set size 1,0.32
set readout horizontal
plot 'run.dat' u 1 w readout format '%4.0f' t 'ITER', '' u 2 w readout format '%9.2e' t 'CONTINUITY'
set origin 0,0; set size 1,0.68
set readout vertical top right; unset key
plot 'run.dat' u 1:5 w l t 'cd', '' u 1:5 w readout format '%6.4f' t 'CD'
unset multiplot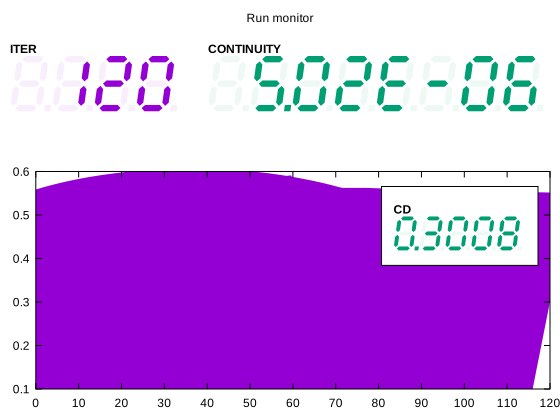
- The value is the last point whose y is finite, after
using,every,indexandsmooth; ranges, log axes and zoom do not apply. A readout takes no part in the autoscale and has no key entry: in a panel with curves, the curves alone set the axes. - The glass is set by the format, never by the value, so a watched readout keeps its width:
formatis a tick format with a field width (%9.2e, not%.2e), without%h. Each character of the field is a cell, except the decimal point, a segment of the cell before it:%9.2emakes 8 cells. A+and the exponent sign+light nothing. Unlit segments are drawn faintly, as on the real displays. - No reading (no finite value yet) or a value wider than the field lights a dash in every cell; digits are never cut. The text around the conversion,
'%5.2f h', is printed beside the glass: a unit. - The label is the item title;
lccolors the digits;lw,dt,pt,psandaxesare errors on a readout. - Placement. The readouts of a panel form a block, a column (
vertical, the default) or a row (horizontal), placed inside the plot area by theset keywords (top left by default, the key being top right) over an opaque window hiding the curves below (noopaque: none). A panel of readouts alone has no axes: the digits grow until the block fills it, unlessset readout size Hfixes their height [px] (2.5 font sizes by default). - In text (
dumb,block), the digits are drawn with_and|, 3 rows of 4 characters per cell, in the item color withansi; the unlit segments are not drawn. In the HTML page, zoom and follow mode leave readouts alone.
Images and palettes
set cblabel 'phi'
plot 'field.dat' u 1:2:3 w image t 'phi(x,y)'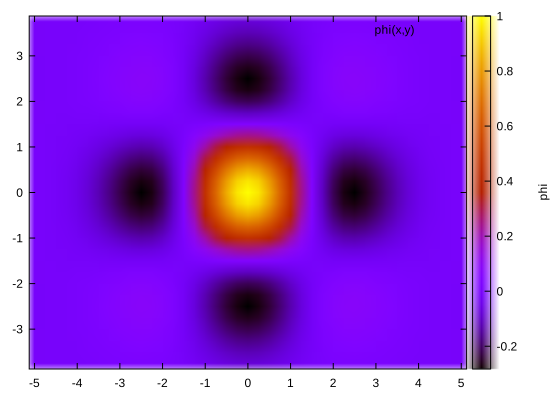
with image colors a regular grid of values (a heatmap): x:y:z points, evenly spaced in x and y (one per pixel centre, missing points left transparent), or a matrix file, the values of each row along x, the rows along y. The x and y axes fit the pixel edges, half a pixel beyond the first and last centres, never extended to the ticks, as gnuplot. Undefined values are transparent.
The palette maps the values over cbrange (autoscaled to the values, not extended) to colors, as gnuplot 6.0 (its test palette values): the default rgbformulae 7,5,15 (black, blue, red, yellow), any of the 37 rgbformulae (a negative number for the formula of 1 - gray), defined (0 "blue", 1 "white", 2 "red") interpolated in RGB (colors #rrggbb or gnuplot names), gray, viridis; negative reverses it, maxcolors N quantizes it to N bands. The color box at the right of the plot shows the palette over the range, with cblabel.
set palette viridis maxcolors 10
set xlabel 'sweep'; set ylabel 'block'; set cblabel 'residual'
plot 'blocks.dat' matrix w image notitle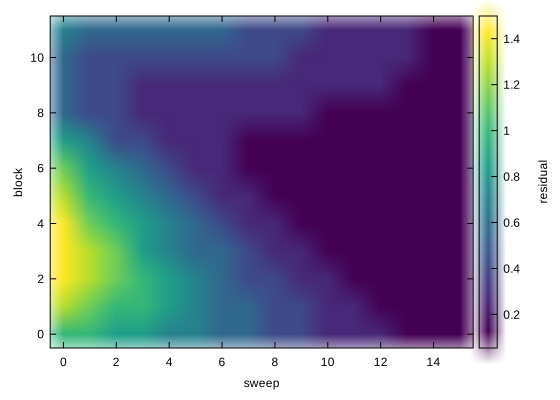
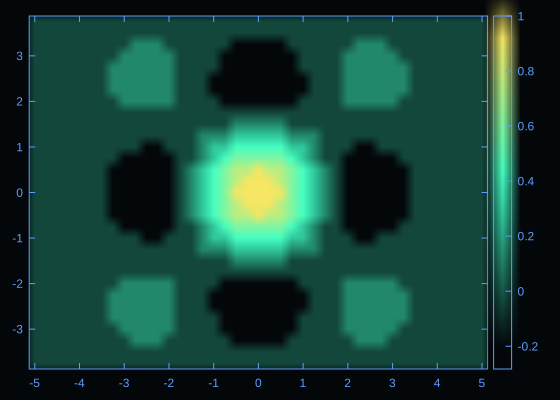
In SVG and HTML an image is an embedded PNG, its pixels kept sharp at any zoom; the HTML page zooms it with the data. In text each character takes the pixel at its centre, denser for brighter pixels ( .:-=+*#%@), in its color with ansi. A theme other than classic replaces the default palette with its own: with vfd, the dark glass for the lowest values up to the emissive colors, and maxcolors turns the heatmap into a grid of lit levels.
Not supported: cubehelix, functions, file palettes, set palette model other than RGB, set colorbox options (position, size, horizontal), set cbtics, set format cb, set logscale cb, pm3d.
with rgbimage (using x:y:r:g:b) and with rgbalpha (x:y:r:g:b:a) color the pixels of a regular grid directly, the components from 0 to set rgbmax (255; 1.0 for fractions), without palette nor color box; an undefined component makes its pixel transparent. Packed ARGB in one column and matrix RGB data are not supported.
Circles, pies and donuts
set style fill solid 0.4
plot 'scaling.dat' u 2:3:4 w circles t 'memory [GB] as radius'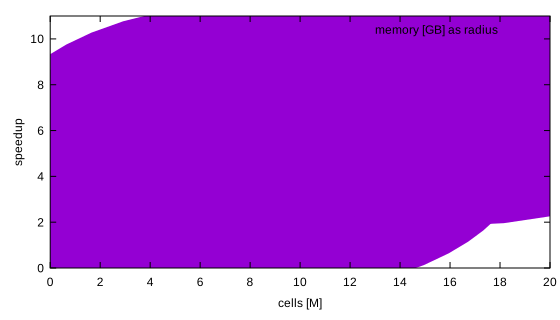
with circles draws a circle per point, as gnuplot: its radius in x-axis units (the third column; 2% of the plot width without it), round on the page whatever the axis scales, filled with the fill style. The x autoscale widens to the circles, the y one does not (gnuplot's choice: their height in y units depends on the page). With two more columns, a start and an end angle in degrees counterclockwise from the x direction, it draws wedges.
set title 'Time per step'
plot 'phases.dat' u 2:xtic(1) w pie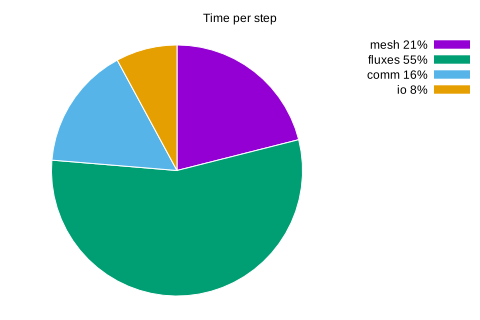
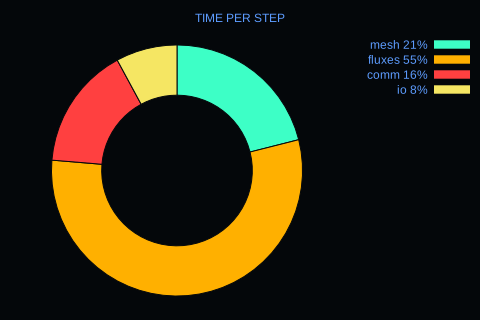
with pie is a foresight extension (gnuplot draws pies only through circles and computed angles): one slice per row, proportional to the values, from 12 o'clock clockwise, each in its palette color; the key lists the slices with their xtic names and percentages. donut F leaves a hole of F times the radius. A pie is alone in its panel, without axes, and takes non-negative values only: slices compare parts of a whole, which a signed quantity is not. Angles read less precisely than lengths: for comparing the parts, histograms are the better chart.
Gauges, radars and roses
Foresight extensions, charts alone in their panel like the pie (several gauges or radar items side by side).
set terminal svg size 600,240 theme vfd
plot 'run.dat' u 1 w gauge range [0:150] segments 24 format '%3.0f' t 'ITER', \
     ''        u 5 w gauge range [0:0.6] segments 24 format '%5.3f' t 'CD'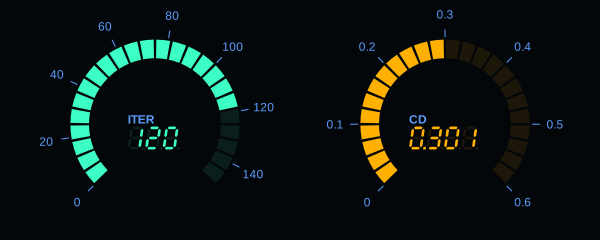
A gauge shows the last finite value of its item, as a readout, on a 270-degree track from 7:30 clockwise to 4:30 over range [A:B] (required: a dashboard scale is fixed). The track is drawn faintly and lit up to the value, in segments N cells if set (a cell lit when covered at least half); the scale ticks lie outside, the value in seven-segment digits of format under the centre, titled by the item. A value beyond the range fills the track, the digits still give it.
set style fill solid 0.3
plot 'radar.dat' u 2:xtic(1) w radar t 'gpu', '' u 3 w radar t 'cpu'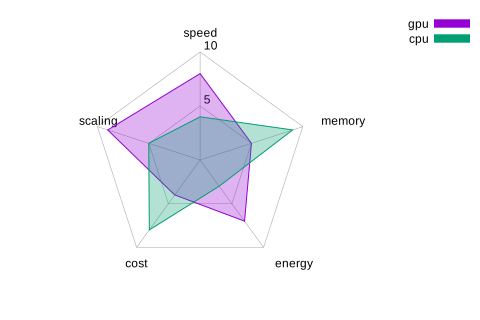
A radar (spider) chart has a spoke per row, from 12 o'clock clockwise, named by the xtic labels; every item is a polygon over the spokes on a common radial scale from 0 (or the smallest value, if negative), its rings at the ticks.
plot 'phases.dat' u 2:xtic(1) w rose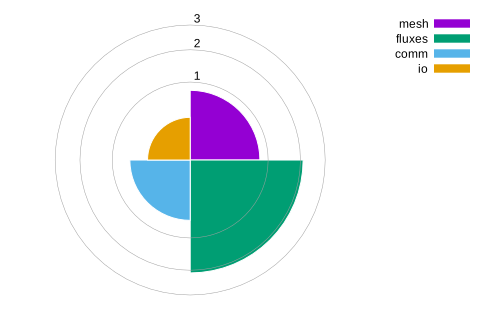
A rose (Nightingale) chart has equal sectors, one per row in the palette colors, named in the key. A sector's area is proportional to its value, so twice the value looks twice as large; rose linear makes the radius proportional instead, the common but exaggerating choice (twice the value, four times the area). The rings mark the values of the scale.
Polar plots
gnuplot's set polar: the items are theta:r, drawn at x = (r - rmin) cos(theta), y = (r - rmin) sin(theta) and joined by straight segments, functions are r of t. As in gnuplot, set polar alone keeps the rectangular frame and the x and y ticks, the r axis running from the pole to the right; the round plot is gnuplot's usual idiom:
set terminal svg size 520,400 theme vfd
set polar; set angles degrees
set size square; unset border; set border polar; unset xtics; unset ytics
set grid polar 30; set ttics 0,30; set key outside
plot 'directivity.dat' u 1:2 w lp t 'probe', 1+cos(t) t 'cardioid'
- theta is in radians unless
set angles degrees(which also makessin,cos,tantake degrees andasin,acos,atan,atan2return them);set theta top clockwiseputs theta = 0 at the top, growing clockwise; - the r range starts at 0 at the pole and ends at the largest |r| extended to the r ticks;
set rrange [1:*]puts r = 1 at the pole, the points below it undefined; with an autoscaled pole a negative r lies across it, as gnuplot; - x and y autoscale to the disc, [-R:R] for R = rmax - rmin, extended to their ticks when these are on;
set grid polardraws rings at the r ticks and spokes,set border polarthe circle of rmax,set tticsthe theta labels outside it (always in degrees),set size squarekeeps the circle round;- the items are
lines,points,linespoints, closedfilledcurves(using theta:r) or readouts (of r), on the first axes; x and y stay linear.
In the HTML page a polar panel zooms as any other: the curves, rings, spokes and border are data, the r tick labels and theta labels are hidden while zoomed. Unlike gnuplot, points beyond rmax are clipped at the plot area as the lines (gnuplot hides them), and the autoscale takes the largest |r| (gnuplot: the largest r, degenerate when all are negative).
Themes and segmented fills
Foresight extensions: the look of the digital dashboards of 1980s cars, for monitoring and showcase pages.
set terminal svg size 640,440 theme vfd
set multiplot title 'RUN MONITOR'
set origin 0,0.62; set size 0.4,0.38; set readout vertical
plot 'run.dat' u 1 w readout format '%4.0f' t 'ITER', '' u 5 w readout format '%6.4f' t 'CD'
set origin 0.4,0.62; set size 0.6,0.38; set key top left
set style fill solid segments 10
plot 'timings.dat' u 2:xtic(1) w hist t 'mesh', '' u 3 w hist t 'fluxes'
set origin 0,0; set size 1,0.62; set key top right
set logscale y; set grid
plot 'run.dat' u 1:2 w l lw 2 t 'continuity', '' u 1:3 w l lw 2 t 'momentum'
unset multiplot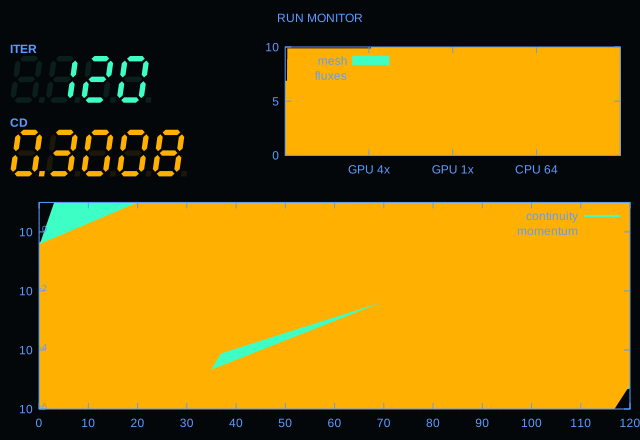
Themes recolor the output, never the figure: classic (the default) changes nothing; vfd is a vacuum fluorescent display, black glass, emissive series colors (cyan-green, amber, red, ...), the frame and labels printed in blue, the data glowing; lcd a backlit liquid crystal display, pale green glass and dark segments. The gnuplot palette colors, the frame, grid and page become the theme ones; a color you give (lc '#123456') is kept. glow and noglow override the theme (only vfd glows by default); the glow is an SVG filter, so converters that do not render filters (some PDF ones) drop or rasterize it. In the HTML page, the ticks and grid redrawn by a zoom take the theme colors. In text the theme only recolors the series, with ansi, ansi256 or ansirgb: the terminal background is not foresight's.
Segmented fills, fs solid segments N (boxes, histograms): the y range is cut into N cells, the same for every bar, as on a fixed-segment display. A bar lights the cells it covers at least half (it reads to the nearest cell: a quantization, a display choice, not a measurement), the other cells of its column are drawn faintly (not drawn in text). Zooming magnifies the cells with the data.
Not supported
User variables and functions (f(x) = ...), inline ranges (plot [0:1] sin(x)), the second x axis (x2, axes x2y1), splot, fit, log bases other than 10, a negative set size ratio; set rlabel, mttics, set logscale r, the rtics placement options; in set xtics, explicit tick lists ("a" 1, ...), minor ticks (mxtics) and the rotate, out options; in set format, the %s, %L, %T conversions; set datafile options other than separator (missing, commentschars); the key at a position (at) or in a named margin (lmargin, ...); filledcurves y1, y2, x1=V, r=; variable colors (lc variable), set style boxplot labels x2; set style histogram columnstacked|errorbars, newhistogram, ytic(), x2tic(), xtic() of an expression or a header name, set xtics add; pointinterval (pi); the smooth filters other than unique, frequency, fnormal, cumulative, cnormal (csplines, acsplines, mcsplines, bezier, sbezier, kdensity, unwrap, path) and bins; the block character sets dot, octants, sextpua, octpua, and its optimize, attributes, charpoints, gppoints, animate options.